


‘‘When people begin anticipating inflation, it doesn’t do you any good anymore.’’
Paul Volcker
We are at important global macro crossroads: Central Banks are trying to remove accommodation from markets to tame inflationary pressures right at a point when the impulse of global growth has lost momentum and we are witnessing a military escalation in Ukraine.
This piece will try to unpack for you:
How Central Banks, the bond and the stock market are reacting and are likely to react further in such a macro backdrop;
How I am approaching this environment with my tactical global macro portfolio.

Without further ado, let’s jump right in!
The Good, The Bad and The Ugly
Actually, before we jump right in.
If you are interested in any kind of partnership or in bespoke consulting services, feel free to reach out at TheMacroCompass@gmail.com.
Back to it: markets are all over the place, what’s going on?
Let’s start from the master of them all: the fixed income market.
Over the last few weeks, bond yields have dropped and yield curves continued to flatten across the board. But the most interesting moves are visible once you decompose nominal yields into inflation break-evens and real yields, and focus on forward looking metrics and probability distributions.
The 35 bps move down in 10y Treasuries over the last 10 trading sessions can be decomposed in:
A 20 bps move up in 10y inflation swaps;
A 55 bps move down in 10y real yields.
The decomposition is even more impressive for 10y European rates: the 20 bps move down in 10y European swap rates is due to a 65 bps increase (!) in inflation expectations versus a 85 bps drop (!) in real interest rates in only two weeks.
Let’s look at inflation swaps (a proxy for market-implied inflation expectations) first.
As markets are forward looking, so should we: instead of focusing on spot inflation swaps, why don’t we have a look at what markets are pricing in down the road and what is the market-implied probability distribution for future outcomes?

The chart above shows how the spike in 10y US CPI expectations (blue) is largely not reflected in 5y forward, 5y CPI expectations (in orange, average inflation prints expected by market participants between 2027 and 2032).
This means that the bulk of the upward inflationary pressures are still expected in the first 5 years, or to be precise: very high CPI in 2022, still high in 2023, declining after.
Good news for Central Banks: long-term inflation expectations have not become unanchored on the upside yet.
Now, let’s move to the bad news.
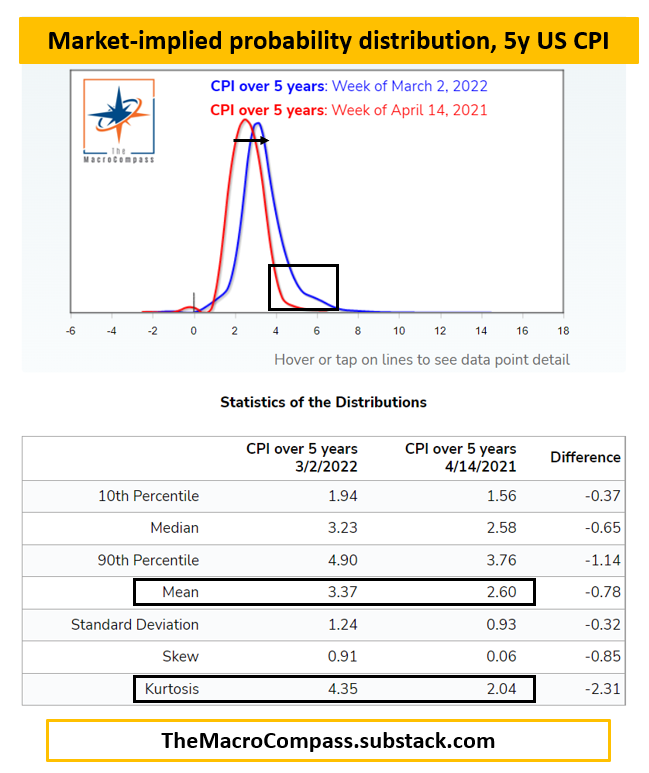
The Minneapolis Fed database is a fantastic tool to quickly grasp market-implied probability distribution: they have data for US inflation (chart above), but also for S&P, bond yields, commodities and more.
The chart above shows the probability distribution for US inflation over the next 5 years priced in by markets today (in blue) versus roughly one year ago (in red).
The distribution has not only meaningfully shifted to the right (mean from 2.60% to 3.40%), but it has become leptokurtic: don’t worry, it sounds difficult but it’s not.
It means market participants are expecting a higher likelihood of non-standard inflationary events, and they are skewed to foresee them realizing in the form of very high CPI prints rather than very low (see here for more on kurtosis).
Average inflation expectations >3% for 5 years and a probability distribution with a fat right tail: bad news for Central Banks with a target of 2%.
Now, to the ugly.
Real yields are dropping like a stone - but not for good reasons.
The impulse of global growth started decelerating in the second half of 2021, and judging by the cliff in my G5 Credit Impulse metric experienced in H121 the downward trend in earnings is likely to persist for few quarters.
That’s because the G5 credit impulse leads earnings by roughly 15 months.
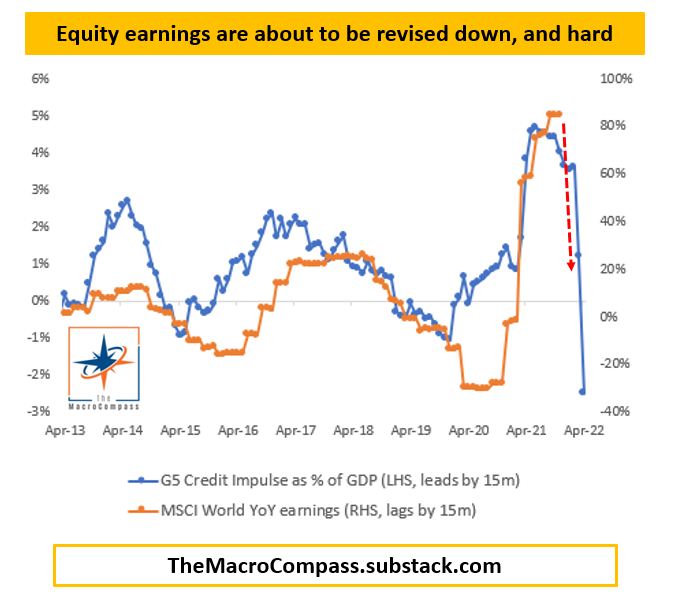
The chart above shows how the global credit impulse leads worldwide YoY changes in equity earnings by 15 months on average.
The direction of travel is clear: downward revisions are coming to a place near you.
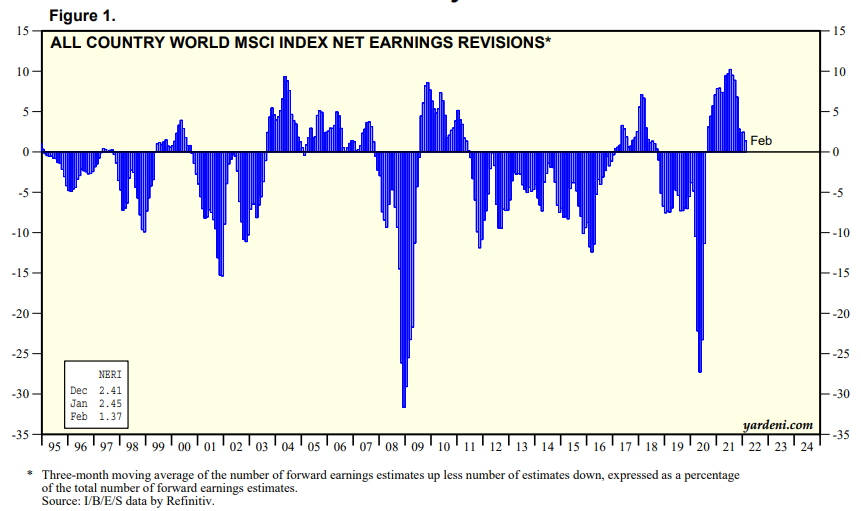
Actually, you might argue some of them are already happening.
The chart above shows the 3-months average of the MSCI World net earnings revisions: essentially, this metric measures the difference between the number of companies revisiting their forward earnings estimate up versus down.
Last time companies were revising their forward earnings estimates down on a net basis while Central Banks were attempting to tighten monetary policy was mid-2018: do you remember what happened few months later?
A 20% equity drawdown: the ugly.
Now to Central Banks: March is going to be a paramount important month for policymakers around the world.
If you are the Fed or the ECB, do you look at the good, the bad or the ugly?

As always, the answer lies in the incentive scheme: at this juncture, as a Central Banker you want to manage the worst tail risk for yourself - a loss in credibility.
Powell has already declared inflation to be his enemy #1, #2, and #3; and while long-term inflation expectations have not yet become de-anchored on the upside, the balance of risks is dangerously skewed the wrong way for Central Bankers.
Hence, hiking to neutral rates in an assertive manner is the path of least resistance.
The Chicago Fed President Evans is amongst the most dovish FOMC members, and last week he came up with similar statements (sure, he doesn’t vote on monetary policy in 2022 but if this is the stance of a dovish FOMC member…think about where the consensus will land at the Fed).
But what does this mean, concretely?
The path of least resistance is for the Fed to hike rates from 0% to at least 2% relatively quickly.
2% is where the most conservative estimates for the US neutral rate stand right now.
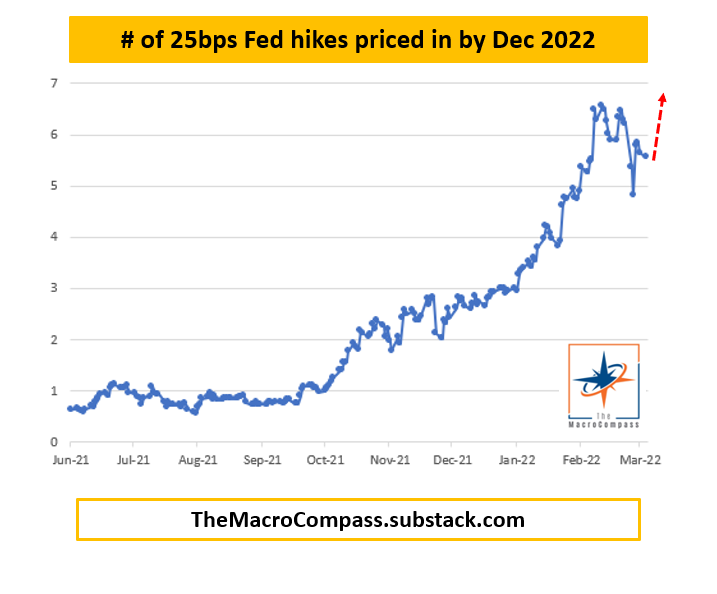
The chart above shows the fixed income market is today pricing in just shy of 150 bps cumulative hikes: traders seem to have re-assessed the Fed reaction function as credit spreads have widened and equities have started retracing.
In other words, financial conditions are tightening and the bond market senses the Fed will be somehow receptive to that - an early version of the Fed put.
This time though I argue the incentive scheme for Central Banks is different: they hope not to be forced to choose, but gun to their head they will likely be forced to tighten even in the face of a stock market drawdown to preserve credibility on their price stability mandate.
The strike of the Fed put is still far from today’s levels.

An example of how far might the strike of the Fed put be is shown above.
Credit default swaps on 5-year US Investment Grade Corporate Bonds are trading at 76 bps at the time of writing: Fed puts (or pivots) became more visible in the past when this measure of credit spreads approached 100 bps.
In other words, the Fed’s focus is all on containing inflationary pressures and providing support to risk assets will only become an agenda point if the pain is big enough to seriously interfere with economic growth.
The bears are knocking at the door, but Central Banks can’t hear them (yet).
So, how do we position for such an environment?
The tactical portfolio approach
In a nutshell: we use the weak growth impulse and macro backdrop to chase Central Banks until one of these three outcomes realizes.
Policymakers tell us where is the line in the sand (roughly where is the point when financial conditions have tightened enough for them to feel the pain?);
Policymakers tell us there is no line in the sand: it’s literally only about bringing inflationary pressures down;
Risk premia have repriced to levels where the risk/reward in being short is not attractive anymore.
At the moment, we are in stage #1: Central Bankers seem reluctant to tell us where the line in the sand is, but they don’t deny there is one and risk premia are widening but they are not at extreme levels yet.
Hence, we stay short where the find the risk/reward to be attractive.
Below, a summary of my open and closed long/short positions:

Every position is sized to lose maximum 2% of remaining capital: the more volatile the underlying asset, the smaller the notional size of my position and vice versa.
The idea is to find good risk/reward trades within my base case macro scenario and target reasonable monthly moves (>1.5 monthly standard deviations) while being stopped out if the move invalidates my macro analysis (1 monthly standard deviation against me).
At the moment, I am short assets highly exposed to a weaker growth/earnings impulse and a quick withdraw of monetary policy support (US small caps, Bitcoin and US High Yield bonds) and long Chinese Real Estate with a smaller size than normal as I expect it will take several quarters before the Xi/PBOC support will be seen in price action.
In rates, I remain in US yield curve flatteners (10y vs 2y): front-end yields should keep pushing higher as the Fed hiking cycle becomes more serious while long-end yields have a hard time increasing at the same pace as long-term growth and inflationary prospects are dampened by structural headwinds and a hawkish Fed in 2022.
Finally, a word of wisdom (hopefully) from my side: notice how my win rate is only around 55% (5 good trades, 4 bad trades) but my P&L is positive as I systematically try to let the winners run and cut the losers short.
Thank you for making it all the way through! :)
If you enjoy my work, I would really appreciate if you could click on the like button at the end of the piece and share the article in your network.
Thank you!
For any inquiries, feel free to get in touch at TheMacroCompass@gmail.com.
If you want more macro insights, you can also follow me on Twitter and Linkedin.
See you soon here for another article of The Macro Compass, a community of about 30.000 worldwide investors and macro enthusiasts!


The Bears are Knocking at The Door