


‘‘I've lived through enough bear markets that if you get aggressive on the short side, you can get your head ripped off in rallies.’’
Stanley Druckenmiller, June 2022
Hi all, and welcome back on The Macro Compass!
In an interview released last month, legendary investor Stanley Druckenmiller reminded everybody how bear market rallies can be a challenging experience for people comfortably sitting on the short side.
Due to their fast and furious nature, they seem to be somehow designed to mine the confidence of the short side.
‘‘What if I am wrong on the big picture macro thesis?’’
’’What if I find myself big times under-allocated in equities and we keep rallying?’’
Over the years running large institutional books I learnt that markets can be humbling, and that continuously challenging your own core thesis is a wise exercise to keep practicing - echo chambers are counterproductive.
Hence, in this article we will:
Look at the current stock market rally in perspective, and try to assess whether we are looking at a bear market rally or witnessing a turning point in risk sentiment that will push equity indexes meaningfully higher;
Refresh our portfolios accordingly.

Is The Music Changing?
Actually, before we jump right in.
Have you ever listened to a macro podcast and asked yourself by the end: how do I actually trade the very interesting views I heard for the last 45-60 minutes?
Well, The Macro Trading Floor fixes that for you!
Every Sunday Andreas Steno and I interview the best worldwide macro strategists and risk takers for a discussion on their current thesis, but after we’ve unpacked their macro big picture we ask them to deliver one actionable macro investment idea!
By the end of the show, Andreas and I also debate how to implement the trade (for both professional and retail investors) and whether we like the trade or not.
We aim at producing a very educational and actionable macro podcast but most importantly also a show full of banter - expect plenty of jokes along the way!
After only 13 episodes, our show is already listened by over 50,000 macro enthusiasts every Sunday - if you are not amongst them yet, why not paying us a visit?
(Apple podcast, Google podcast, Spotify, Blockworks YouTube channel).
Now, back to it: bear market rally or turning point?
Let’s first assess the magnitude of this rally in historical context - our friend Mr. Blonde has put together quite the dataset in his exceptional, outstanding free macro newsletter (must subscribe: link here).
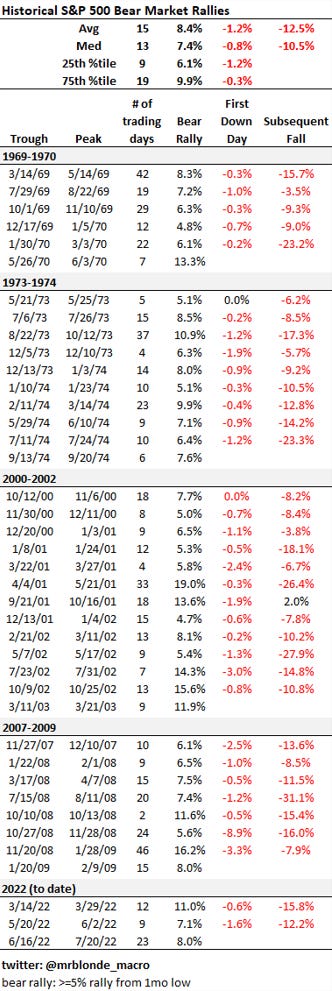
Over the last 50 years, there have been 5 major and sustained bear markets which saw 40 episodes in total of 5%+ rallies from the 1-month lows.
Bear market rallies, indeed.
They lasted on average 3 weeks and delivered a fast and furious 7-8% return.
The 8% rally we just experienced from the June 16th lows would hence be of average size, with its length (> 4 weeks) being above average - notice though most of the returns were achieved already after one single week.
Now that we know more about the size and length of this rally from a historical perspective and keeping in mind that equity market returns are mostly driven by changes in valuations and earnings growth, let’s look at what global macro indicators are telling us about its nature: bear market rally or turning point?
1. Real Rates, Valuations and Risk Premia
Changes in equity valuations are closely linked to changes in (long-end) risk-free real interest rates.
That’s because:
A) Large, multi-asset investors don’t look at asset classes in a vacuum and their starting point isn’t ‘‘cash under the mattress’’ - it’s the real return of the most liquid, risk-free investment they can make: Treasuries. When that prospective return changes, the marginal appetite to buy more or less risky assets changes too.
B) Stock prices are the net present value of all future (inflation-adjusted) cash flows whose value is discounted to today - change the real discounting factor, and ceteris paribus the stock price will change too.
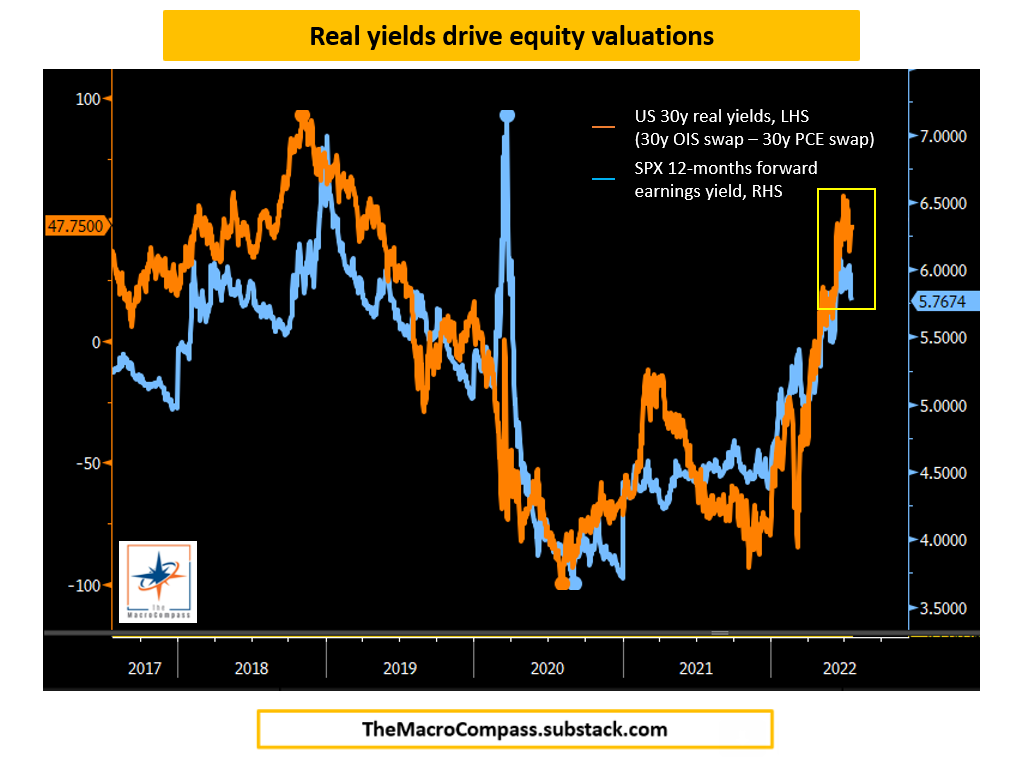
After a very aggressive (+150 bps!) move up from the lows in Nov-2021 (-90 bps) to their highs in June (+60 bps), US 30y real yields (chart: orange, LHS) have slightly dropped and stabilized around 50 bps.
As you can see, this has helped the 12-month forward S&P 500 earnings yield (chart: blue, RHS) drop from 6.1% to 5.8% - that’s the equivalent of 1 full point higher in forward P/Es from 16.4x to 17.3x and explains most of the rally seen so far.
Could real yields drop further and spur another valuation-led rally?
The Fed has been very vocal: as they want to keep conditions tight to tame inflation and they estimate the US equilibrium rate sits around 25 bps, they are keen to keep the entire US real yield curve above this level until they see meaningful progress.
Moreover, do equity valuations always blindly follow real yields?
Not really: it depends on the Equity Risk Premium.
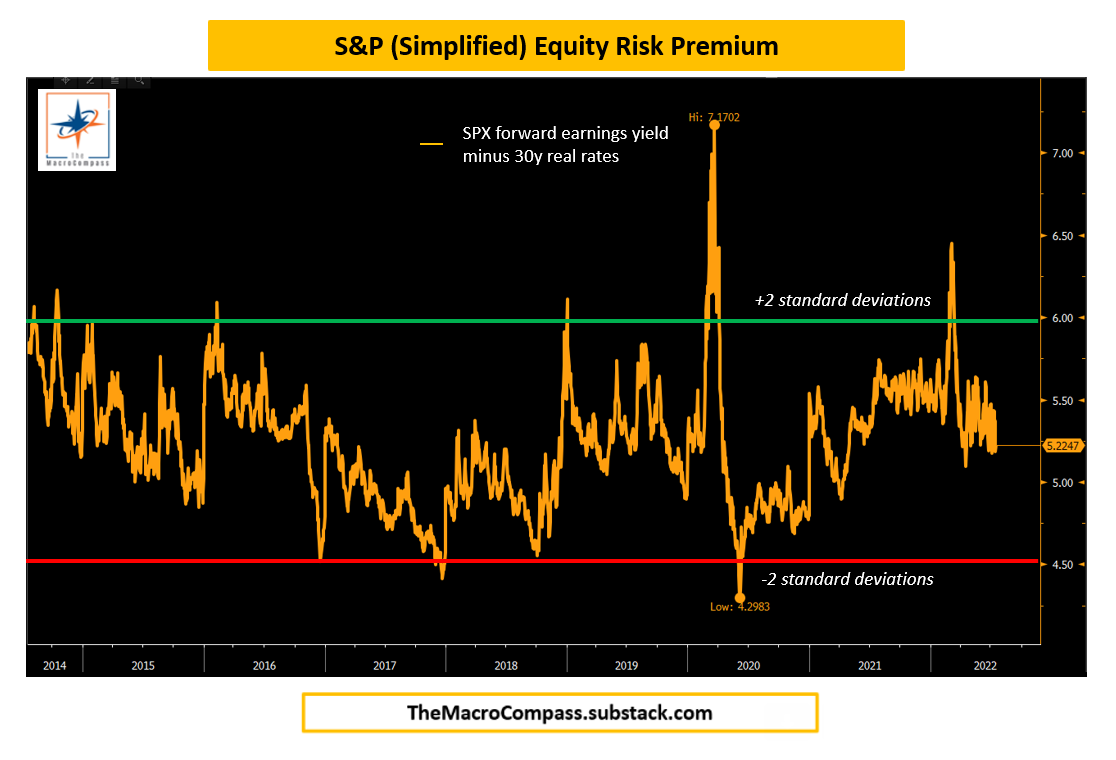
When real yields increase or drop but valuations don’t adjust accordingly, it means the perception of risk amongst investors is changing.
My simplified version of the Equity Risk Premium sits into its 8-years average: equities can hardly be defined ‘‘cheap’’ given the challenging macro context.
In short: the real rates / multiple expansion side of the rally could go a bit further, but its upside is limited by both the Fed’s willingness to keep real rates into restrictive territory and the already contained Equity Risk Premium vis-à-vis challenging macro conditions.
2. The US Dollar
The US Dollar plays a pivotal role in determining whether this rally has legs to morph into a sustainable turning point for risk assets.
A stronger US Dollar as the global economy slows down hurts foreign entities which have borrowed in USD and need strong trade and economic growth to service their Dollar liabilities.
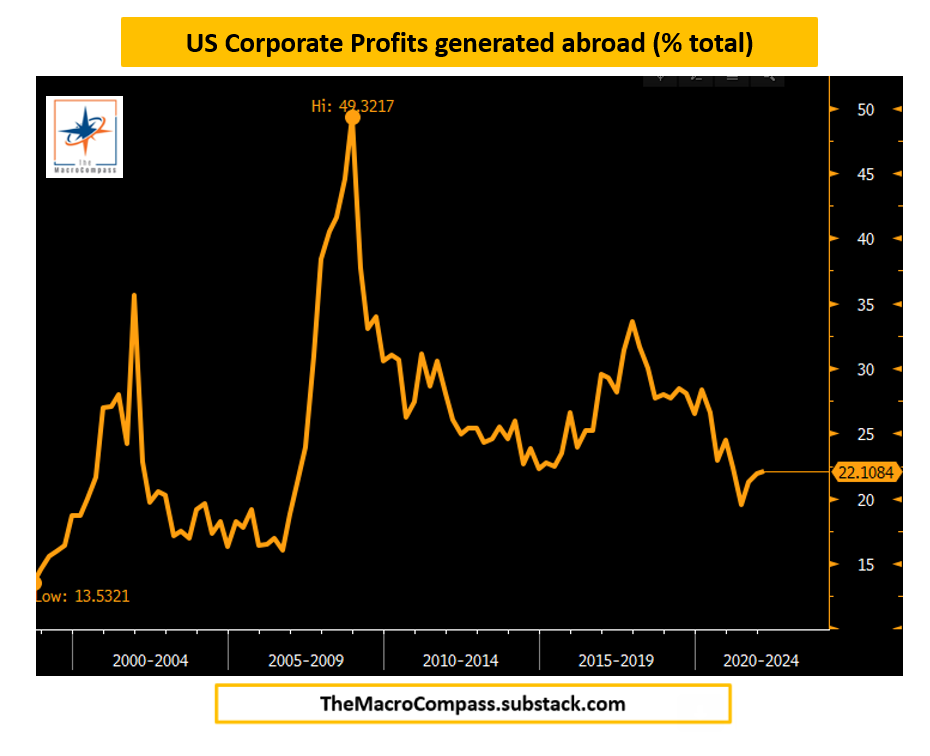
Moreover, it also affects US corporate profits.
Over the last 20 years, US companies have expanded the volume of sales and corresponding profits they generate abroad: a stronger USD hurts this non-negligible source of income for American corporations.
Lower real yields in the US (even better if validated by a Fed dovish pivot) would make the US Dollar immediately less attractive against other currencies, and this would help risk assets rally further.
At this stage though, the Fed doesn’t seem ready to endorse lower real rates and a subsequently weaker US Dollar and the global de-leveraging process is keeping the USD overall quite still bid.
In short: The USD is still way too strong to provide any sustainable tailwinds to this risk asset rally as it will act as a drag on both foreign corporate profits and suppress the broad risk sentiment in markets.
3. The Yield Curve
When it comes to future economic growth and hence the prospect for earnings, the shape of the yield curve can be a very powerful guide.
A steepening yield curve signals confidence towards future strong economic growth which is going to allow for sustainably higher interest rates; on the opposite, a flattening (and inverted) yield curve signals financing conditions in the foreseeable future are likely to be too tight and damage economic growth to the point Central Banks will be forced to cut rates.
Curves are inverted and flattening further in the US, but also worth looking at what the bond market is pricing the Fed to do against what the Fed told us they will do.
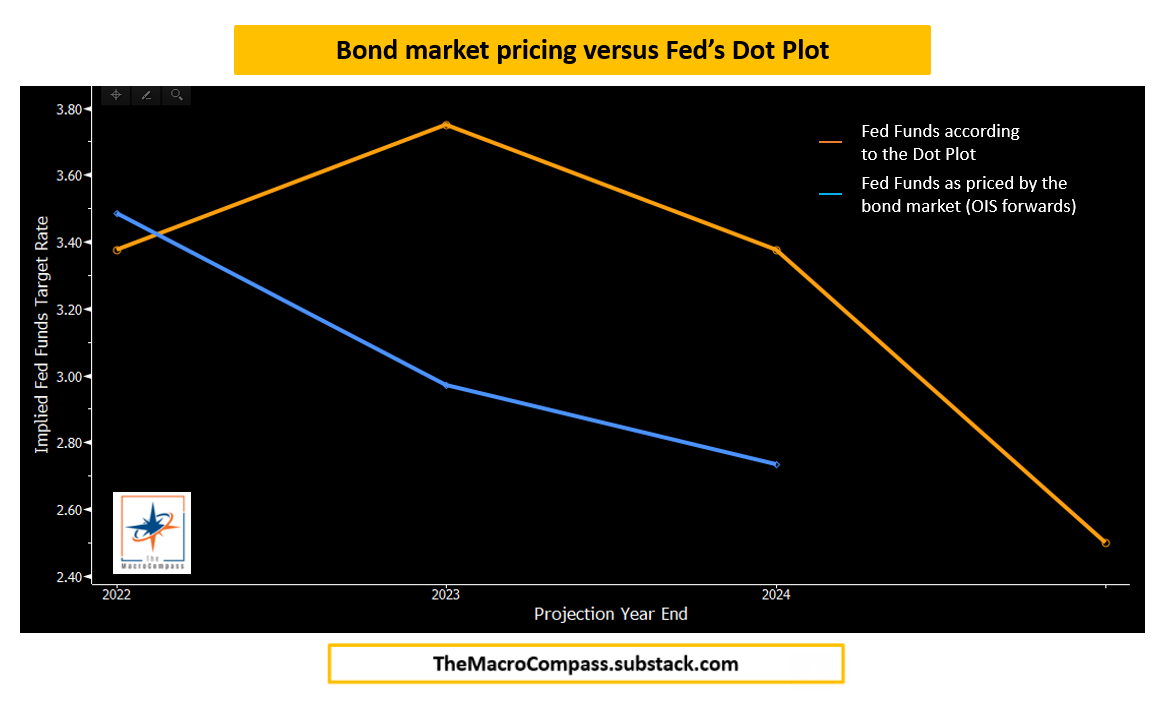
Some of the rally we have seen is also due to equity markets ‘‘cheering’’ on bond markets pricing 100 bps (!) worth of Fed cuts in the period between Q123 and Q124.
This is the result of a probability distribution that assumes a 50%+ chance of Powell pivoting dovish essentially by year-end already - and that probability is already priced in risk assets too.
The question is: as time goes by, will Powell try to move that probability rather towards 0% or 100%?
When it comes to future earnings instead, inverted yield curves are as loud as a noise can be: it’s not looking good.
In short: if you are looking at the yield curve shape and searching for signs that earnings growth will provide tailwinds to this risk rally, look elsewhere; when it comes to valuations, the Fed is priced to turn convincingly dovish: do you embrace a 50%+ probability they will, and as soon as December?
I don’t like the odds yet.
Conclusions & Portfolio Updates
The last month rally in equities ranks roughly as an average bear market rally: is it one, or does this rally represent the start of a significant bullish turning point?
Overall, my macro assessment seems to suggest we are witnessing a bear market rally indeed and only a convincingly dovish pivot by the Fed would provide additional tailwinds to the bullish narrative via higher multiples.
The only way to get a proper dovish pivot is a sharp slowdown in the momentum and breadth of inflationary pressures.
And do you know what has always been able to generate one?
A recession.
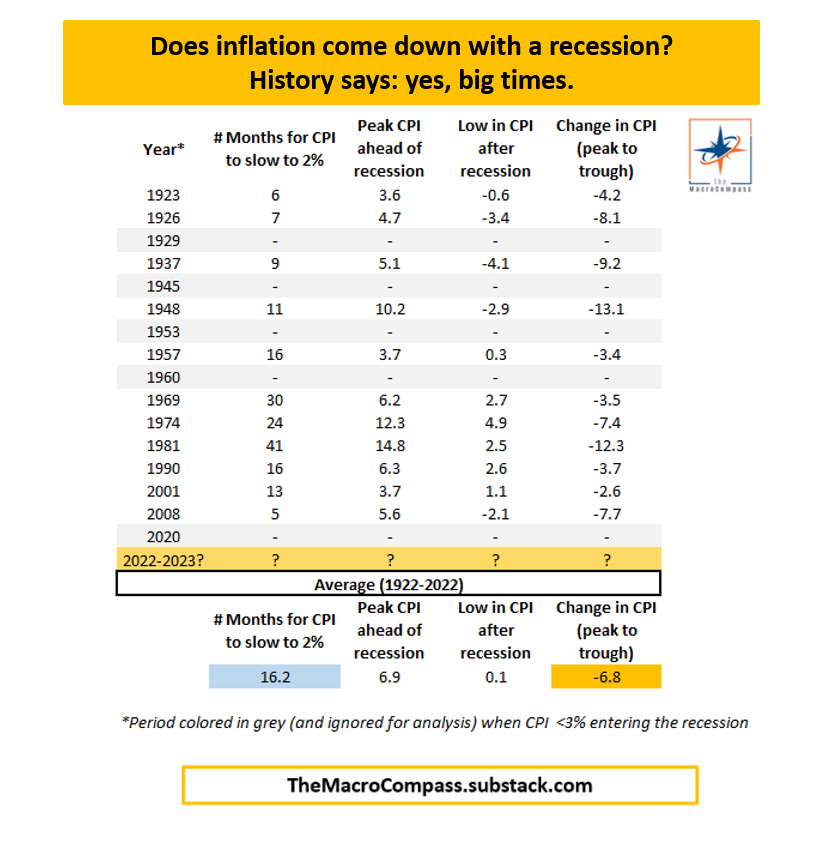
I looked back at 100 years of US recessionary episodes and I found out that in 11/11 cases in which we entered a recession with inflation above 3%, we came out of it with a much lower CPI.
It took on average 16.2 months to slow inflation down from the peak to 2%, and the average decline in CPI from peak to trough was a whopping -6.8%.
There is nothing to be happy about a recession, but at least history says it would be a very effective way to reduce inflationary pressures back to at least 2%.
Finally, a word on my long-term structural and tactical portfolios.
Given my assessment, you won’t be surprised to hear my long-term structural portfolio is still heavily allocated to USD cash and long-end bonds (that TLT is working!) while my risk asset allocation is as small as it can be and skewed towards the highest quality/defensive and away from speculative/high-beta names.
My tactical portfolio instead looks like this:
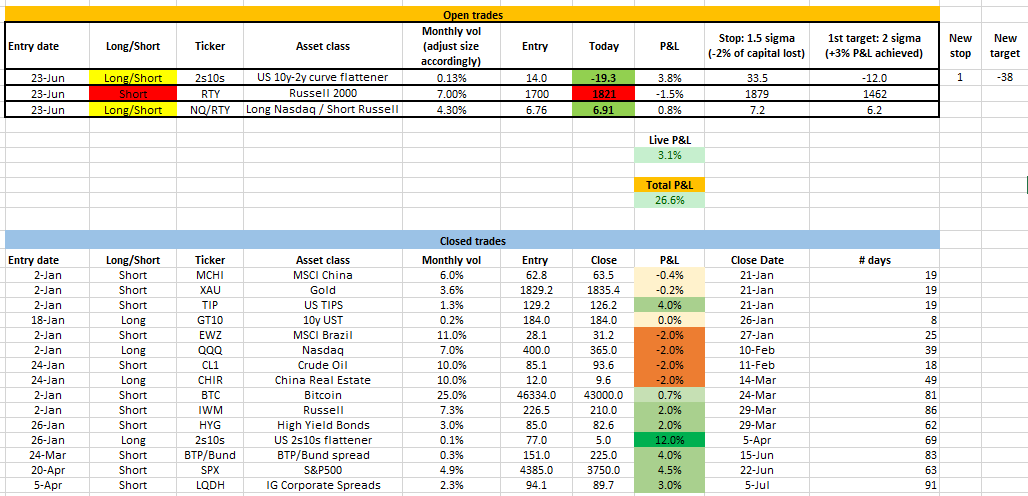
Taking quite a hit on the short Russell leg, but being more than offset by the yield curve flattener trade and the long Nasdaq / short Russell relative value trade.
In line with my view that this looks and smells like a bear market rally, but always ready to stop out if proven wrong by macro conditions and price action.
P.S. Yes, I still owe you a detailed piece on how to structure such trades and most importantly how to size and risk-manage them: I promise it’s coming! :)
And this was all for today, thanks for reading!
If you are interested in any kind of partnership, sponsorship, or in bespoke consulting services feel free to reach out at TheMacroCompass@gmail.com.
Finally: may I ask you to be so kind and click on the like button and share this article around, so that we can spread the word about The Macro Compass?
It would make my day!
See you soon here for another article of The Macro Compass, a community of more than 70,000+ worldwide investors and macro enthusiasts!
For more macro insights, you can also follow me on LinkedIn, Twitter and Instagram.
Feel free also to check out my new podcast The Macro Trading Floor - it’s available on all podcast apps and on the Blockworks Macro YouTube channel.
For any inquiries, feel free to get in touch at TheMacroCompass@gmail.com.
DISCLAIMER
The content provided on The Macro Compass newsletter is for general information purposes only. No information, materials, services, and other content provided in this post constitute solicitation, recommendation, endorsement or any financial, investment, or other advice. Seek independent professional consultation in the form of legal, financial, and fiscal advice before making any investment decision. Always perform your own due diligence.


Bear Market Rally or Turning Point?