


15’ reading time
Hey everybody, welcome back to The Macro Compass!
What’s the Macro End Game?
In short, another great reset of our monetary system.
We often talk about what markets are going to do next month, or this year. We like the feeling of being in control of asset class performances: after all, achieving consistent alpha year after year is has remained an elusive task for many. Hence, we must try.
This obsession about short-term market performance puts investors at great risk of missing the forest for the trees - this article will zoom out and focus on the forest.
Specifically, we will cover:
How did we get here (our current monetary system)
The options ahead
The Macro End Game

Without further ado, let’s jump right in!
Cheap credit is cheap money from the future
In 1971, the Gold Standard effectively came to an end.
President Nixon ended the convertibility of USD into gold at a fixed price, and effectively introduced the fully elastic fiat system we have been living with since then.
That’s how it works: commercial banks and governments can now create credit out of thin air and add net worth to the private sector without having to worry about the intrinsic value of the newly created money - the peg to gold is gone.
For more insights on how commercial banks (via lending) and governments (via deficits) create money out of thin air, check out our evergreen article on this topic.
The main drivers of long-term economic growth peaked in the ‘80s, and politicians find it unpalatable to have the economy grow at a slower pace.
Especially when they are sitting on a monetary system that allows fully elastic credit creation: so, let’s leverage it up guys!
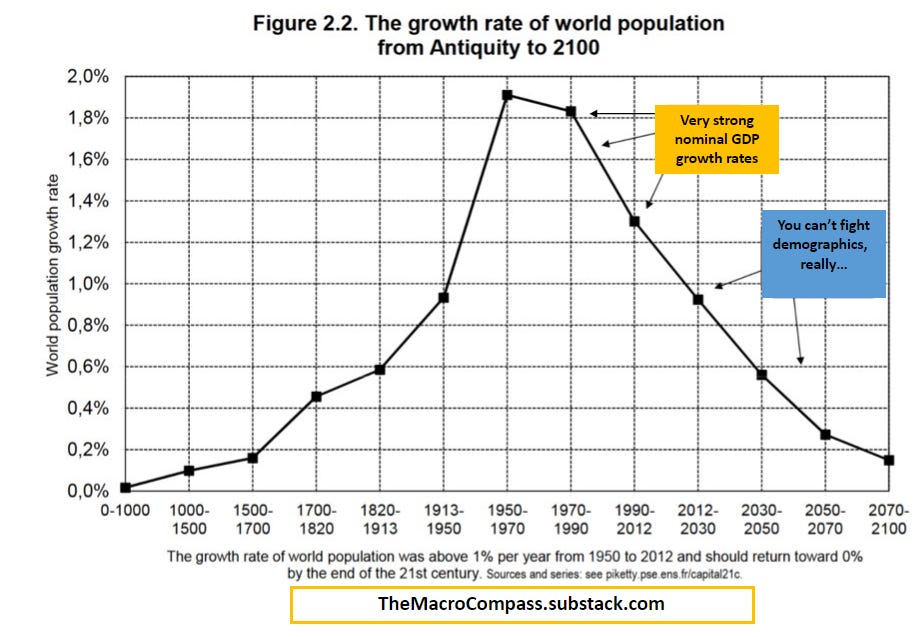
The main drivers of economic growth in the long run are working-age population growth and productivity growth: both peaked in the ‘80s.
Here is a 2000-years chart of the growth rate of world population.
I guess the trend is clear, right?
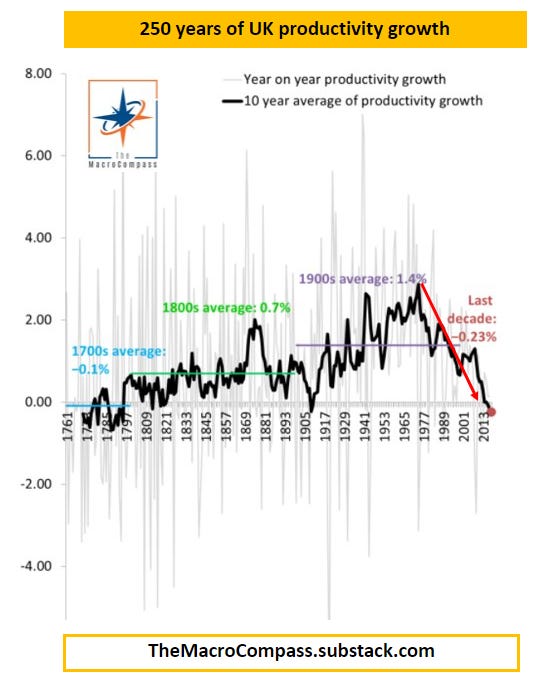
And here is a 250-years chart of UK productivity growth.
I added a red arrow, which probably wasn’t necessary to prove the point.
Alright, so long-run potential growth after the ‘80s started moving inexorably south, and what did we do? As any company looking to boost earnings and activity…
World Inc. started to use leverage.
Healthy private sector balance sheets allowed for private sector debt expansion, and governments across the world started running more fiscal deficits too.
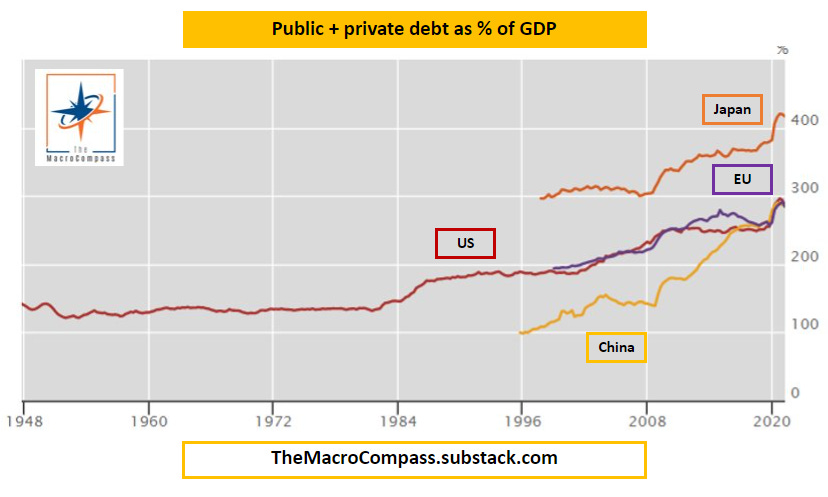
The chart below shows private and public debt as % of GDP - the party starts in the mid-80s in the US. Also notice as every jurisdiction in the world is doing the same, perhaps with a different mix between private and public sector leverage.
But everybody has leveraged up, big times.
Cool, but servicing a mountain of (often unproductive) leverage is expensive.
Inflation-adjusted servicing costs are relevant for borrowers: while you pay nominal interest rates to service your debt, inflation reduces the real amount of your due future liability. Hence, real interest rates are the relevant metric to look at.
The trick here is simple, but genius: lower real interest rates.
Here, it’s important for you to understand that the downward trend in (real) interest rates since the ‘80s is a feature of our monetary system, rather than merely the result of monetary policy actions.
True, Central Banks have gone the extra mile in cutting short-term nominal interest rates and embarked in once-considered unorthodox monetary policy (e.g. QE) but the equilibrium real interest rates would be very low anyway.
Equilibrium is the key word here.

Short recap:
Our economic system produces poorer and poorer long-term economic growth due to low population growth and stagnant productivity
To achieve politically and socially acceptable growth rates in the short-term, we continue to leverage up both in the private and public sector
Real interest rates drop further and further to keep the system afloat: Central Banks accommodate this process with monetary policy actions.
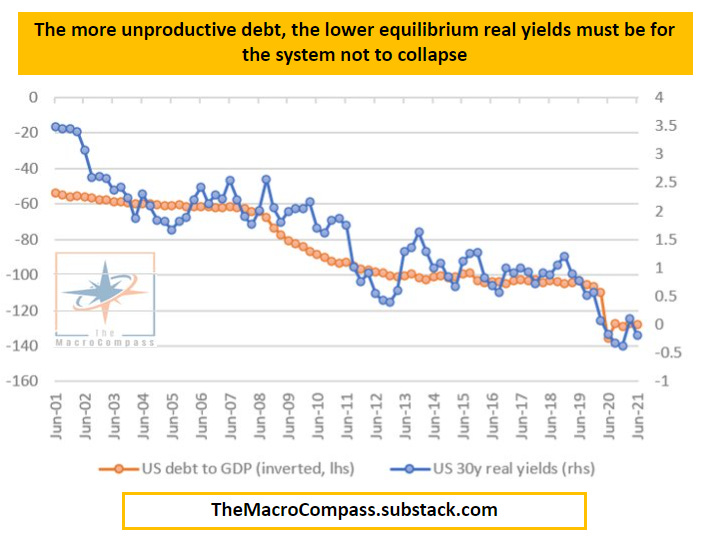
The chart below shows how 30-year US real interest rates (blue) must drop to lower and lower levels as debt/GDP (orange, inverted) grows larger and larger.
The real genius feature of this system is what I call the ‘‘wealth illusion’’ effect.
Let’s go through this theoretical exercise to understand what I mean.
Say you bought a house in the US during the early ‘90s and let’s assume the bank lent you 100% of the purchase value (100% LTV). Just an assumption, bear with me.
You wanted to spend about $1.000 per month in mortgage installments and given 30-year mortgage rates at 10%, that meant you could buy a house worth approximately $120.000.
Now, fast forward to today.
You still want to spend $1.000 per month in mortgage installments, but now your 30-year mortgage rate is 3%.
You can now ‘‘afford’’ a house worth $240.000: double the initial price.
The previous owner who paid $140.000 for the house now feels ‘‘richer’’.
To further back the wealth illusion point, consider that the US Case-Shiller Home Price index has gone up by 258% (!) since 1990 but once you adjust it for inflation and the drop in mortgage rates, here is what you get.
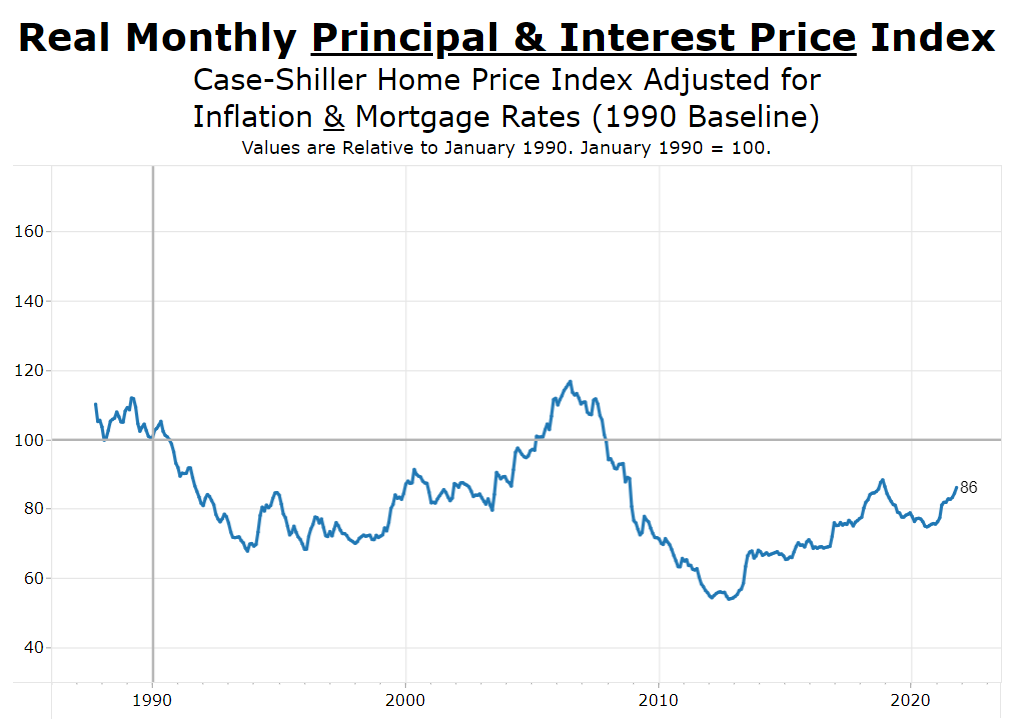
You can apply this methodology to ‘‘rationalize’’ how our economy system works and also why asset classes valuations keep soaring. Of course, there will be pockets of over/undervalued asset classes - I am not here to argue that Rivian is cheap, but just to provide you with the tools to understand how the wealth illusion effect works.
Credit creation + lower real yields = the wealth illusion effect.
Nice, but we have a problem.
The problem, the options, and The EndGame
Many people believe the problem with this system lies in the debt/GDP ratio.
Not really, especially when it comes to the public sector.
The government balance sheet does not work like a household’s: governments are the monopoly issuers of currency, and hence they can always refinance as long as the broad public has trust and credibility in their means to ensure the stability of the currency they are issuing.
The real problem here is that for the current system to thrive, incremental leverage must be accessible at ever lower real interest rates.
This ensures both the ‘‘affordability’’ of incrementally higher debt levels and the continuation of the ‘‘wealth illusion’’ paradigm.
Now, how do we ensure real yields fall more and more? Either via lower nominal yields or via higher inflation (expectations). Or both, combined.

Nominal yields can’t fall much further due to the proximity to the lower bound - if nominal yields fall way below -1%, storing physical cash in a vault becomes a somehow viable alternative despite insurance and transferability issues.
In certain jurisdictions (Japan, and arguably the US) there is also quite some political opposition to negative nominal interest rates in the first place.
Inflation expectations are already around 1-2% in most developed countries, and trying to engineer those higher might a) prove to be very difficult, and b) at some point dangerous, as a de-anchoring on the upside of inflation expectations is not palatable for the price stability mandate of Central Banks.
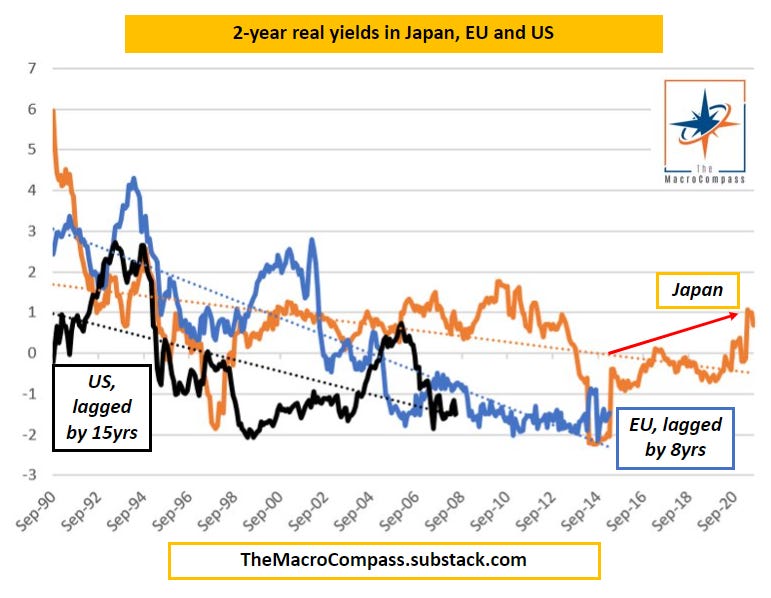
Japan leads the way in this experiment, with the EU lagging by 8 years and the US by 15 years approximately.
Real yields have struggled to fall further in Japan.
So, what are the options ahead?
Deleveraging: politically unviable. If creating credit is the equivalent of printing money, deleveraging = destroying money. An extremely painful process that inflicts large losses to 2 generations of people that have lived and prospered through the wealth illusion effect. The establishment is never going to volunteer for this political hara-kiri.
Kick the can down the road: favored by the establishment, but it will fail. As a former G10 Prime Minister once told me, the establishment loves the status quo and wants to be re-elected. The wealth illusion paradigm can run a bit further, but income inequality is growing larger and subsequent episodes of social unrest are more common. CBDCs are part of the ‘‘kick the can down the road’’ project (check out the thought-provoking article by Doomberg here), in an attempt to impose lower and lower real interest rates and work around the lower bound issue.
As we kick the can down the road, we make the system inherently more unstable and prone to the butterfly effect: a tiny butterfly moving her wings (e.g. real yields moving a bit higher or a small recession) is enough to generate a tornado in markets.

The Macro End Game is hence a monetary system reset: the classic gold standard existed for 50+ years before WWI and WWII disrupted it, and we attempted to restore it from the mid-40s until 1971.
The current monetary regime has been in place for 50+ years now, and while nobody knows when The Macro End Game will happen, there is one smart thing we can all do to be more prepared for it: own assets that have a convex payoff to this event.
A convex payoff is defined by an asymmetric compensation in your favor: the holder of the instrument with a convex payoff would share the upside but would not incur in major losses in case the downside would realize.
So, what are the assets exhibiting a positively convex payoff in case of a monetary system reset?
Gold.
As argued here, I believe gold would be interpreted as the go-to hard asset to try and engineer a new monetary system: it has already served that purpose, and it is already sitting on the balance sheet of all the largest monetary institutions worldwide.
But a new gold standard also comes with its inherent limits: gold has storage + insurance costs and transferability issues.
Other hard assets which are inherently scarce and hold indispensable value to human society also could work: I am thinking of farmland or residential real estate (without underlying mortgage). But obviously the government can tax those big times.
What about a Bitcoin standard?
If you believe the probability is 0%, then you hold 0% Bitcoin.
I am just going to say assigning a 0% probability to a future potential event in markets has rarely proven to be a good idea.
Do I believe the probability is 20%? No.
Do I believe the probability is >0%? Yes, marginally. I will cover why in a future article.
As I believe the probability is indeed marginally >0%, I own some Bitcoin in my long-term asset allocation portfolio.
Now, closing the article with a humble request.
I am trying my utmost best to deliver the sharpest possible, free macro insights and investment ideas here at The Macro Compass. I am so grateful for the big support I have received so far, but here I am with one small additional ask.
If you enjoy my work, please consider clicking on the like button and share the article.
It costs you literally nothing, but you would be helping me a great deal!


The Macro EndGame