
Hi everyone - this is Alf.
I hope you're having a great day.
Alongside with running my hedge fund, I work as a consultant and external advisor for some of the largest pension funds, asset managers, banks and funds in the world.
Arrangements are flexible: from access to my institutional research + daily access to me all the way to monthly or quarterly calls and sitting through your investment committees.
If you think I could add value to your firm, simply reach out at:
alf@themacrocompass.com
Please state your name, company, and how you think I could help.
And now, to today's macro research piece.
Let’s start this macro piece with a little game.
Below you find two tables representing 3 consecutive prints of core CPI in the US including its subcomponents: core goods and core services (with a separate mention for ‘’supercore’’ CPI).
Without using Bloomberg or Google, are you able to tell which 3-month core CPI streak belongs to the pre-pandemic period and which one to today?

I wasn’t, and some of the hedge fund PMs I asked the same question ended up making a mistake.
In both cases, core CPI MoM prints were averaging 0.15-0.20 which is broadly in line with the annual 2% inflation target and the subcomponents painted a picture of 0% goods inflation with core and super-core responsible for the quite muted inflationary pressures.
The answer: section 2 covers the Jun-Aug 2019 period, and section 1 shows Core CPI for Mar-May 2025.
I think we should take some time to reflect on this.
In early 2019, Powell pivoted dovish with a clear speech highlighting the tightening cycle was over and the Fed was all about accommodating financial conditions.
Core inflation averaged 0.2% MoM in summer (higher than today), unemployment rate was 3.7% (lower than today, and stable), and the Fed moved on to cut rates from 2.25% to 1.50% in Q3 2019.
Fast forward to today: the last 3 core inflation prints averaged 0.14% MoM with weaker services inflation, unemployment rate is steadily climbing up at 4.24%, and Fed Funds sit 200 bps above summer 2019.
The Fed might soon capitulate dovish.
Also, amidst this tariff noise it’s helpful to take a step back and remember core goods only represent ~20% of the core CPI basket.
The real action lies in services and housing (dis)inflation.
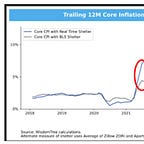
The guys at WisdomTree developed a real-time core inflation metric that uses actual housing inflation rather than the lagging shelter CPI metric:

Core CPI using real-time shelter inflation (blue) has been around 2% for 18 months already, but the lagging nature of shelter CPI (grey) pushed official core CPI higher limiting the ability for the Fed to cut.
The lagged disinflation in housing seems set to continue, which means the official core CPI measure might keep declining based on official shelter inflation dropping (it’s 35-40% of the core CPI basket: it matters).
Notice how using real-time shelter inflation works both ways.
The red circle highlights the mid-2021 period when the housing market was ultra hot but shelter inflation didn’t yet show up in the official core CPI – which tricked the Fed into mistakenly delaying the hiking cycle.
The opposite has happened in 2024, but the last 3 core CPI prints are now decisively dovish.
It’s time to follow the Fed very closely to grasp when the dovish turn might come.
The title of this piece is ‘’null komma null’’, a German expression which means 0.0 and we can say the excess inflation today compared to pre-pandemic periods is actually null komma null.
But there is another ‘’null komma null’’ which is crucial for markets and asset allocation.
A close friend, mentor and hedge fund PM recently had a chat with a German pension fund manager and asked him how much additional USD hedging they have done given the correlation break between EURUSD and risk assets.
‘’Null komma null’’. Nothing, no additional hedging has been done.
Basically, pension funds and insurance companies remain very long (and hurting) the US Dollar:

The reason is very simple: FX hedging costs are still high, and pension funds/insurance companies have return targets to meet.
Picture this: the standard return requirement for a pension fund is 6.5/7.0%, and if you are in Switzerland or Japan hedging your USDCHF and USDJPY exposure for the next 12 month costs 3.5-4.0%.
That’s quite a hefty negative carry to pay, and this deters pension funds managers from hedging.
But.
In a scenario where:
The Fed turns dovish and starts delivering cuts
USD hedging costs start to drop
The USD depreciates further, reminding foreign pension funds of their losing long USD position
We could see a fast acceleration in USD hedging demand from foreign whales around the world.
Such hedging activity would compound USD weakness very rapidly.
If such an outcome unravels, the market implications are pretty straightforward.
Short the denominator, long the numerator.
The US Dollar remains the denominator of most financial assets out there, and the combo of a dovish Fed turn + Trump policies + hedging activity would definitely ‘’weaken the denominator’’.
When it comes to the ‘’numerator’’ (i.e. what asset you go long vs the USD), my view is:
FX: prefer currencies potentially involved in hedging flows (EUR, CHF, JPY, AUD, CAD etc)
Equities: prefer sector/countries with high pricing power (tech, large cap) or commodity exporters
Commodities: long metals (gold, silver etc)
This was it for today, thanks for reading!
Alongside with running my hedge fund, I work as a consultant and external advisor for some of the largest pension funds, asset managers, banks and funds in the world.
Arrangements are flexible: from access to my institutional research + daily access to me all the way to monthly or quarterly calls and sitting through your investment committees.
If you think I could add value to your firm, simply reach out at:
alf@themacrocompass.com
Please state your name, company, and how you think I could help.


