US unemployment rate and Fed tapering
TMC #1! Mainstream financial commentators are overlooking the most important labor market indicator and drawing misleading conclusions about what Fed tapering really means.
Get to know your new friend U6 unemployment rate and why it matters
Labor data for May were just released in the US. Everybody is focusing on non-farm payrolls and U3 unemployment rate, and I think they are missing the point. Other measures are more relevant, for instance the U6 Unemployment Rate.
The U-6 (Unemployment) rate represents the percentage of the labor force that is unemployed, underemployed, and discouraged from seeking jobs.
So, the unemployment rate excludes from the numerator any unemployed person who has not recently looked for a job or who is working part-time as she struggles to find proper employment. Quite an overlook, I would argue.
While the headline rate everybody is looking at just ticked <6%, the true unemployment rate in the US is still >10%.
We have a long, long way ahead of us before a thorough reduction of the slack in the US labor market happens and the progress is rather slow at this stage.
Unemployment rates are an interesting statistics, but we tend to focus a lot on the numerator - the unemployed portion of the labor force.
If the labor force is the entire cake, the unemployment rate represents a slice of this cake. We talk a lot about this slice, and not much about the cake. So, is the cake shrinking or expanding? Are we gonna have a larger or smaller labor force?
OECD estimates for year-on-year labor supply growth are negative for all developed economies. US and Western European labor forces will shrink at about -0.5% and -1.0% per year over the next 3 decades.
Don’t miss the forest for the trees. The slack in the US labor market is rather big as indicated by U6 and the long-term prospects for the labor force is very negative.
Connecting the dots: labor market -> r* -> Fed tapering
Together with productivity, the labor supply growth is an important input for the long-term equilibrium real growth rate of an economy.
The “natural” rate of interest, or r-star (r*), is the inflation-adjusted interest rate that is consistent with full use of economic resources and steady inflation.
R* is not observable, but it can be estimated with models, e.g. Laubach-Williams. Most of these models use productivity and labor supply as relevant inputs.
The prevailing real interest rate is observable though, and it is simply defined as:
Like other central banks, the Federal Reserve exerts a strong influence on the level of short-term real interest rates by setting the benchmark (Fed Funds) for the nominal short-term interest rates. Inflation expectations completes the picture.
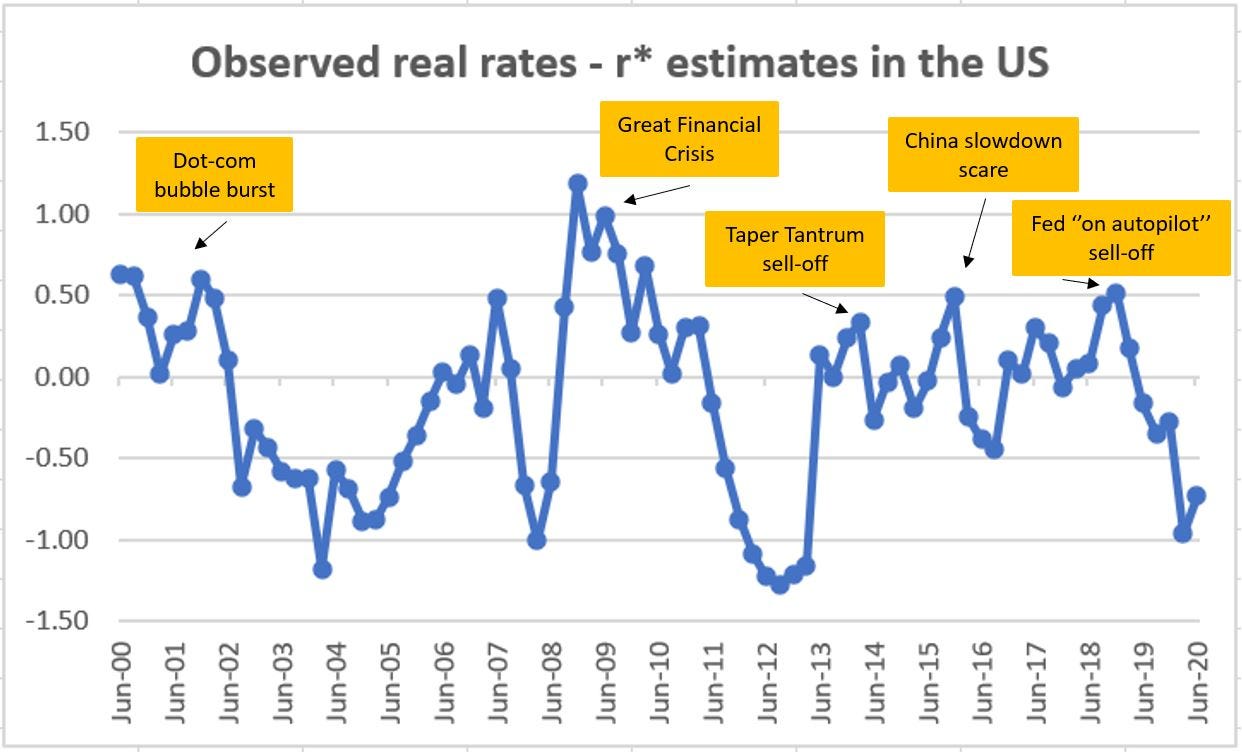
Historically, when the Fed allows observable real interest rates to trade above estimates for r* for a sustained period of time, risk assets drop.
Now, we have a problem. As labor supply growth is negative and productivity pretty stagnant, the latest estimates of r* in the US hover around 0%.
So, what’s the band-aid solution? Negative real interest rates.
Observed real rates minus r* estimates in % in US for the last 20 years.
What does this have to do with Fed tapering?
When a central bank goes for tapering, they effectively embark in an exit strategy from their QE program. Net-net, they reduce policy accommodation and this is generally associated with higher observed real interest rates.
Tapering = less QE = investors extrapolate a less friendly central bank = less policy accommodation = drop in inflation expectations and higher nominal rates required to own bonds = higher real interest rates.
The graph above shows higher real interest rates are not good for risk assets, especially if the increase is quick and the landing point is above r* (0% today). Every time observed real interest rates traded above r* estimates for some time, risk assets dropped and hence forced authorities to intervene again (e.g. Powell in 2019).
The Fed knows this as well from the 2013 taper tantrum and the 2018 ‘‘on autopilot’’ experiences + the labor market slack is still very big. The tapering hype is highly exaggerated.
By the way, QE tapering still means buying bonds on a monthly basis. Yes, they will still expand the balance sheet and inject excess liquidity, but at a slower pace. For context, that’s how the Fed balance sheet looks like.
If you made until here, you deserve a prize.
In my next article, I am going to talk about my asset allocation and actionable investment ideas based on my macro framework.
I will introduce the concept of the Macro Compass and how it helps in providing inputs for your investment decisions.
Feel free to comment and/or ask questions below. I will reply to all of them.
Ah, and please subscribe to the newsletter if you liked it!
See ya!


Hey Alfonso - interesting thoughts! Can I ask which Bloomberg tickers you use to construct the "Observed real rates minus r-star" plot, please? Can't bring it up quite the same to play about with...thanks.
Alfonso could u explain this part regarding tapering:
less policy accommodation = drop in inflation expectations and higher nominal rates required to own bonds
i understand that less policy accommodation results in a drop in inflation expectations. But why are higher nominal rates required to own bonds?
if there's a drop in inflation expectations, shouldn't investors require lower nominal rates to own bonds, considering that inflation will not erode the interest rate yield of bonds as much?