The 2020s are less similar to the 1940s than you think
TMC #11! Real yields were stubbornly low in the 1940s, and I expect the same in the 2020s. That's about it with the similarities though: watch out for the material differences.
Hi all, and welcome back on The Macro Compass!
Let’s jump right into it, as I gave birth to a relative value trade that fits well the (secular) Quadrant 1.
Reminder: this is my own personal view and trades refer to what I might do with my private account savings, nothing to do with my job or my employer. Myself perhaps putting on a trade does not mean you should. Always do your own homework.
Trade alert!
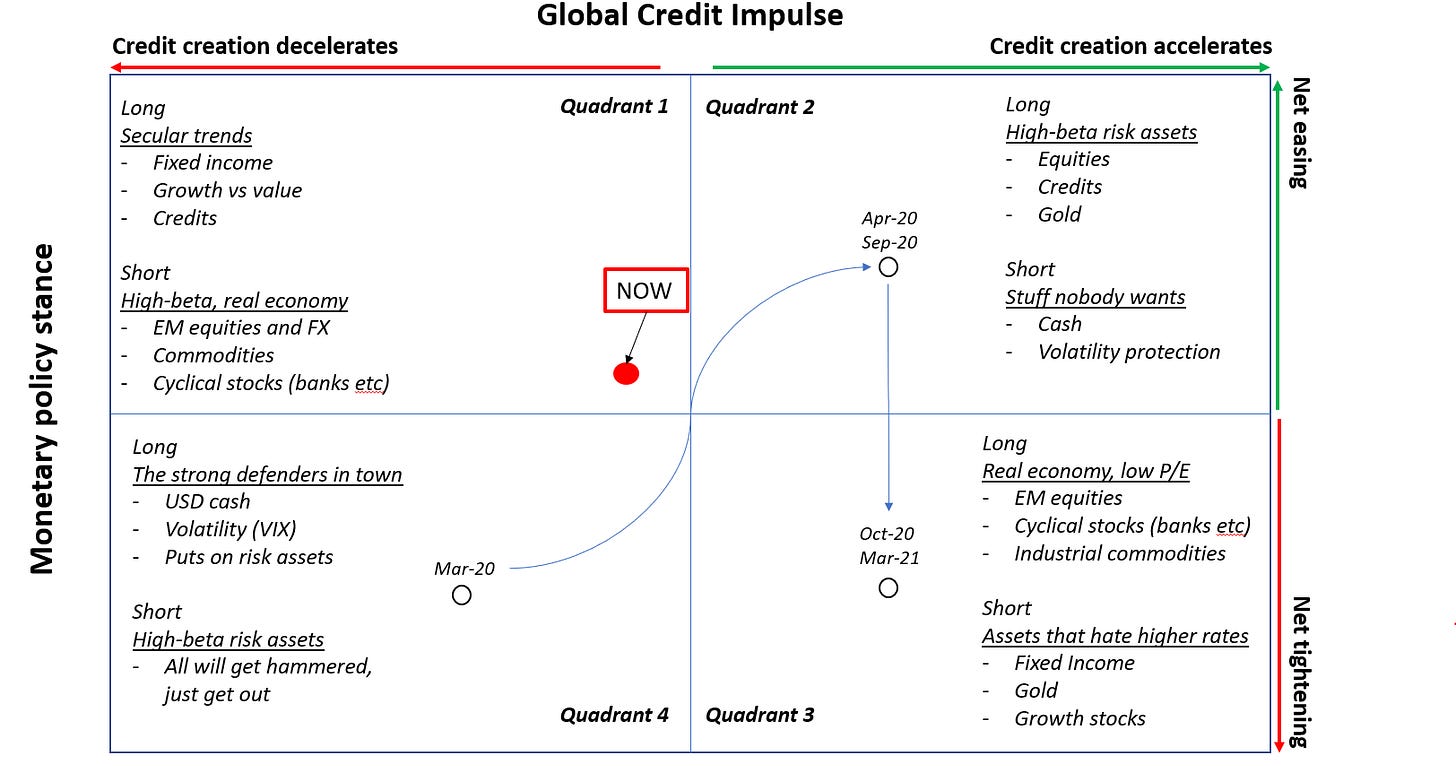
As pointed out in TMC#10, my analysis shows we’re firmly back in Quadrant 1, but we might peek into Quadrant 4 from time to time.
Hence we are looking for a trade that fits into the long secular trend, short high-beta real economy stuff + that holds up ok if we temporarily morph into risk-off.
So, here we go:
Long Nasdaq (NQ1 future, or pick your instrument of choice) @14.925
Short European Banks (CA1 future, or pick your instrument of choice) @90.3
I am planning to hold this for 1-2 months at least, unless stopped out earlier.
The standard deviation of rolling monthly returns for this relative value trade over the last 10 years has been 8%.
I am eyeing a >2x sigma returns (15% or more) and putting my hard stop at -10%.
If the trade moves 10% in the money, I am going to adjust the hard stop and trailing profit targets up accordingly. You’ll see an update here in case.
Reminder: this is NOT investment advice. The above has to be interpreted as a public journal for a fictitious, paper portfolio. I always represent myself and not my employer.
Why did I choose this expression for a Quadrant 1 trade? Two main reasons.
If we sit in the secular Quadrant 1, both legs should work ok.
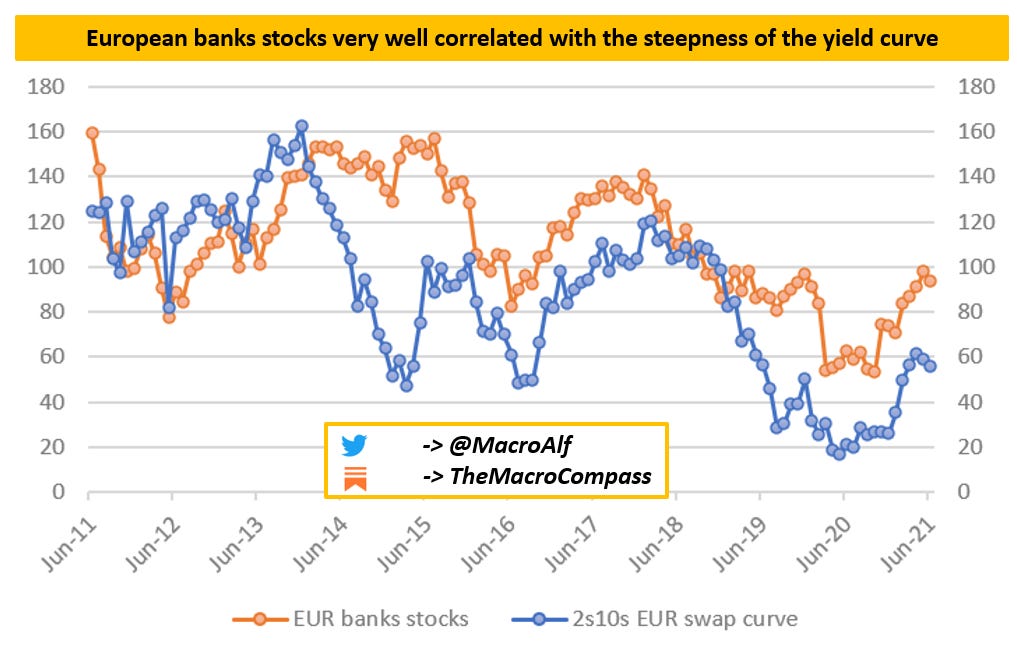
Banks like steeper yield curves as their maturity transformation business naturally benefits from it (liabilities are generally shorter in duration than their assets are).
Steeper yield curves imply higher earnings, which ceteris paribus reflect in higher stock prices. Flatter yield curves…well, the opposite.
The chart above is pretty telling: the yield curve in Europe has resumed its structural flattening trend but European stocks are still trading relatively well, also courtesy of the (well flagged imho) dividend payment resumption.
I’d expect this leg of the trade to start working well at some point, i.e. European bank stocks to reprice lower due to weaker future margins on a flatter yield curve.
Nasdaq is the highest quality, most intensive duration proxy equity index out there.
It is the main beneficiary and poster child asset class for the secular Quadrant 1. It should keep on performing well if we keep on sitting in Quadrant 1.
If we peek into the scary Quadrant (4), the trade should still work
In a risk-off environment, high-beta real economy linked assets get hammered more than long duration proxy assets. Nasdaq should hold better than European banks.
Also, for a European based investor like me, this trade also has an embedded short EUR/USD position built in it. Risk-off events are often associated with a weaker EUR/USD for good macro reasons.
Good luck to me!
The 2020s versus 1940s hype
The macro topic for this Thursday update is going to be a comparison between 2020s and 1940s. You must have read everywhere the 2020s will be a copycat of the 1940s.
Well, hold your horses.
In my opinion, there will be some striking similarities but also massive differences.
Let’s start from the similarities.
There is a very striking one: negative real interest rates.
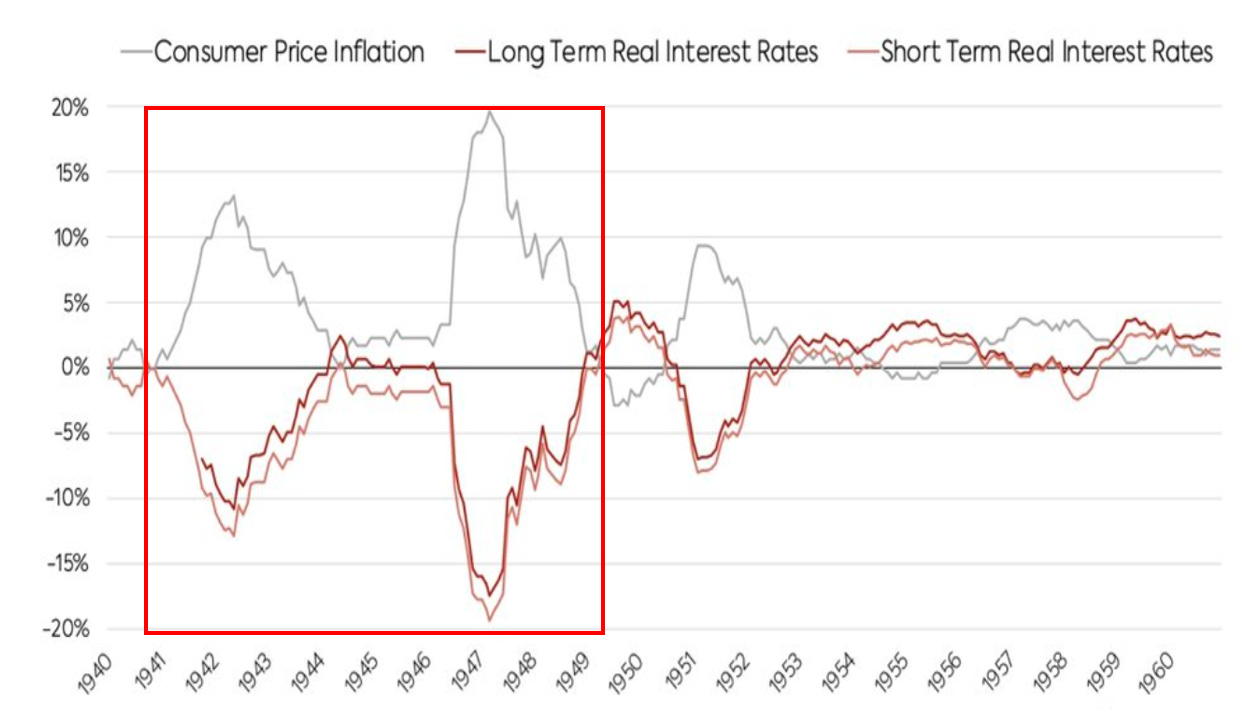
In the 1940s, the Federal Reserve kept nominal interest rates below prevailing inflation rates for basically a decade, hence forcing negative real yields on Treasury bonds.
This was deemed a necessary action to fund the WWII spending and the successive economic reconstruction efforts and it was achieved via orthodox monetary policy when possible, and via outright yield curve control (YCC) when necessary.
Investors who decided to stick to risk-free instruments (buyers of Treasuries and savers depositing money on bank accounts) lost >30% of their purchasing power in real terms. The US government and private sector borrowers were the main beneficiaries as their real debt servicing costs were negative or anyway very low.
Risk-free real interest rates are likely to stay negative in the 2020s as well, but the structural economic forces driving the 2020s are materially different from the ‘40s.
Negative real yields will be achieved via (zero or) negative nominal yields and modest inflationary pressures following short-lived credit impulses.
No 10%+ CPI for years or 4-5%+ real economic growth in sight.
Forget about that.
So, why won’t we have the ‘‘roaring ‘20s’’?
What are the material differences between the 1940s and the 2020s?
The drivers of structural economic growth today are much weaker than the ‘40s
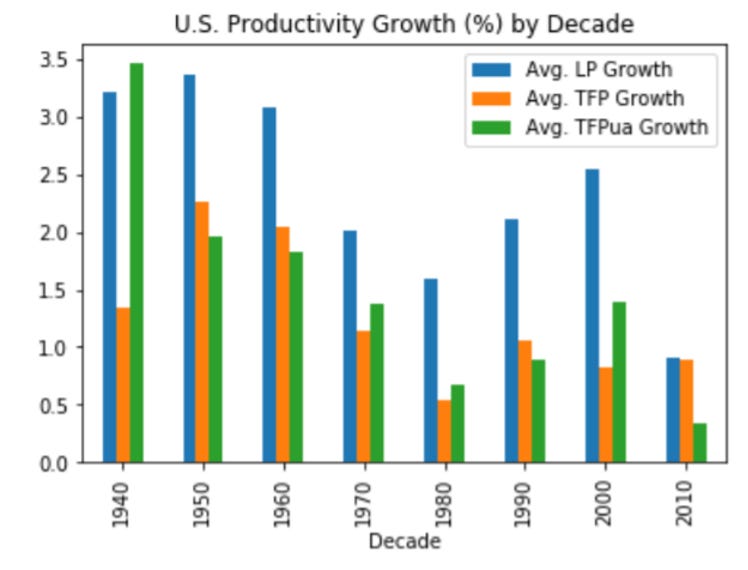
Labor supply growth and total factor productivity growth drive long-term potential growth. It’s that simple, no rocket science.
US population growth in the 40s-50s was around +1.5% per year.
It’s now quickly heading to 0% per year.
Labor supply growth YoY will quickly turn negative.
Less people working every year.
Less. Every year.
And those less people working are not more productive than they were in the 40s.
In the 40s, the potential YoY real GDP growth in the US was around +4-5%.
Today, it’s <1%. Materially different.
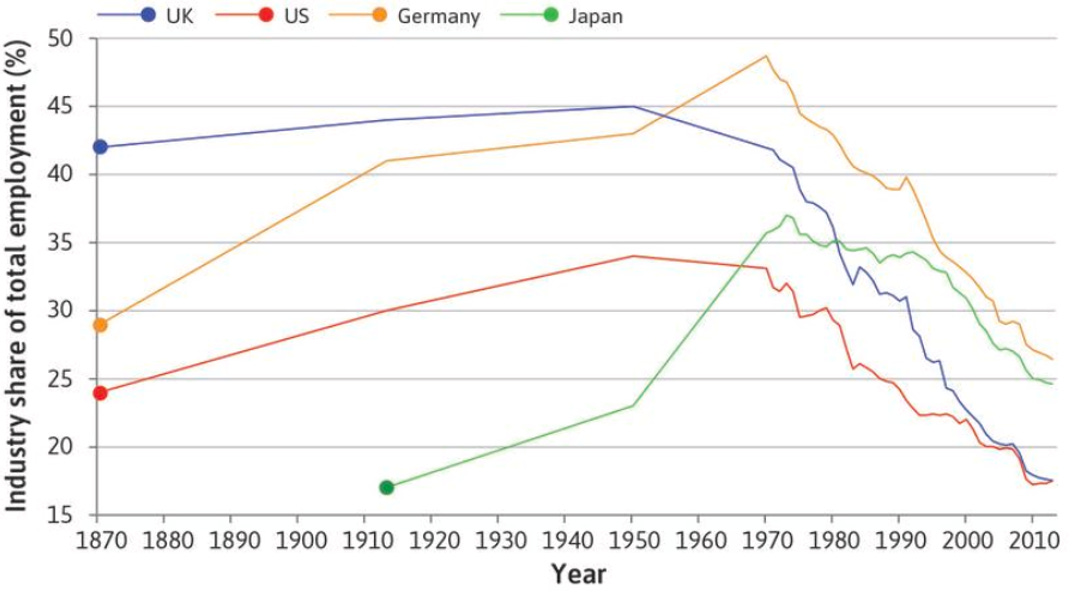
Please consider that the 40s were a labor-intensive industrial age.
The economy in the 2020s is service-led and dominated by tech, which is easily scalable. Today, a business requires 1/10th of the employees to produce the same USD 1 million sales compared to 50-70 years ago.
Labor unions are much less powerful as well.
Where is the wage bargaining power going to come from?
Without sustained real wage growth, there is no sustained push in aggregate demand and hence no sustained nominal growth.
We end up with the usual pattern: we try to overlay cyclical growth on a very poor structural growth via expanding credit (or using the flipside: debt).
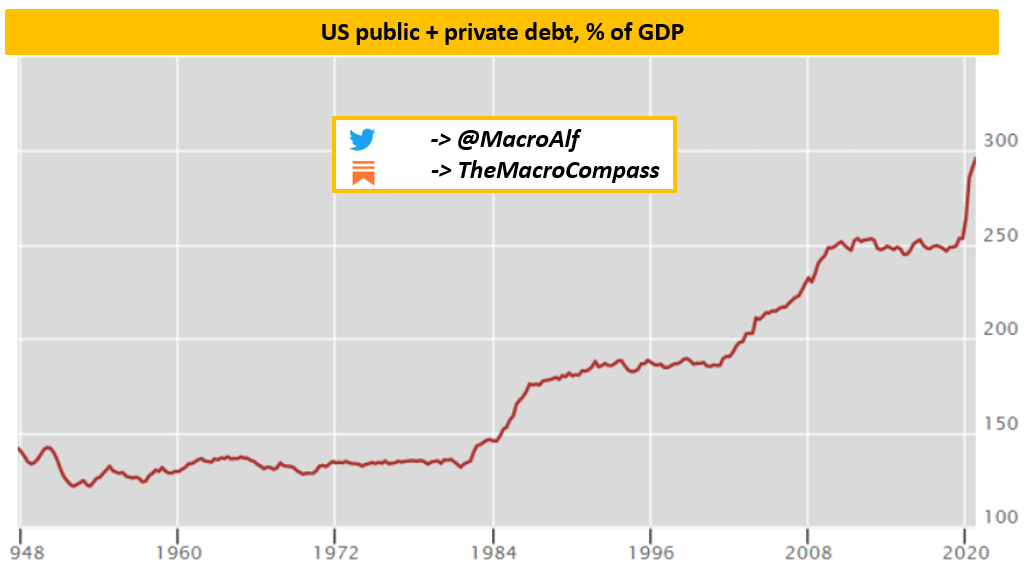
The public and private debt starting levels are very different.
In the 1940s, total debt/GDP in the US was around 150%.
Now it’s 300% and counting. The system is hugely over-leveraged already.
And while the public sector (government) is a currency issuer and can decide to ‘‘print’’ its way forward, the private sector is a currency user and needs real cash flows to service its mountain of debt.
As the structural economic growth and hence the cash-flow generating power is very poor, the private sector is not willing to borrow more.
Even if the public sector prints deficits, it’s very likely that the private sector will use them to pay back existing debt or to boost savings.
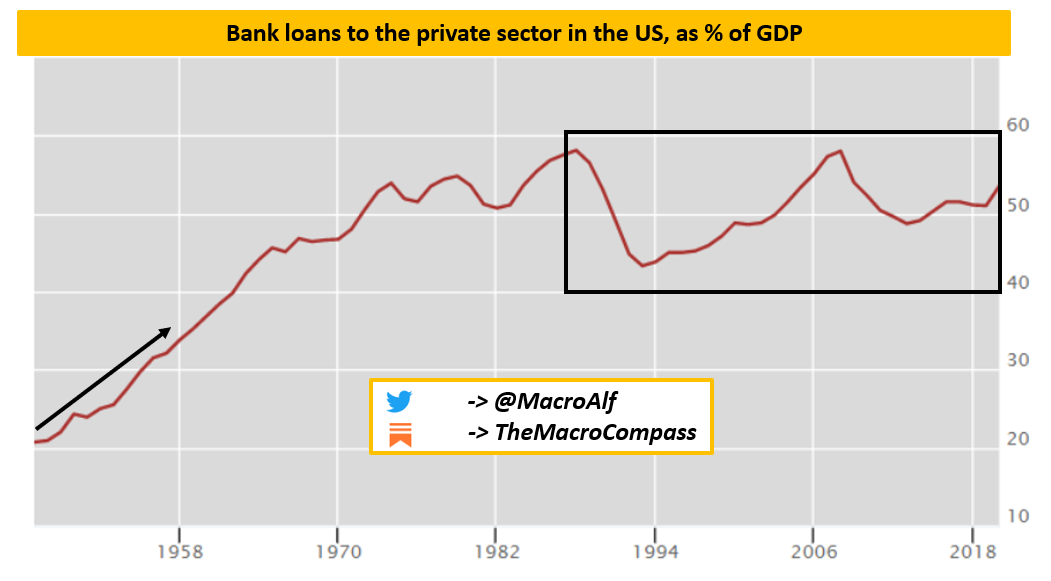
While in the 1940s commercial banks were extending credit towards an unleveraged private sector at a fast pace, they have basically stopped doing so today.
The private sector does not want to borrow more, and banks don’t lend as their Return on Equity for loans is very poor: loan yields are low, borrowers’ creditworthiness is debatable and regulation requires them to attach significant capital to each loan.
I believe risk-free real yields will remain negative or anyway well below real GDP growth for the next decade - the same happened during the 40s.
But I don’t believe we are going to see neither sustained double digits CPI prints, nor a strong real and nominal GDP growth.
The private and public sector are overleveraged, and the structural trend growth of developed economies is very poor. This is not a labor-intensive industrial age but rather a service-led economy where scalable tech plays a big deflationary role.
Wage bargaining power is mediocre, the population is ageing and there is no strong aggregate demand push like in the 1940s.
Whether you like it or not, secular trends are here to stay.
If you liked this article, why not share it with your (social) network?
This community is growing very quickly, and I’d like to keep it that way. The more, the merrier!
You can share on several platforms clicking on the button below.
If you are not subscribed yet and you’d like to receive updates directly in your inbox, you can subscribe clicking on the button below.
I generally publish 2x per week (Monday and Thursday) covering weekly market developments, posting trade ideas and digging deep into broad macro topics.
For free, without ads.
See you at the next update!




Great article! Thanks.
Thanks for other fine article. Three more differences between the 1940’s and today: 1) YCC was paired with austerity. Everything valuable to the war effort was rationed. 2) In the US, Medicare and Medicaid did not exist. Social Security was new, small, fully funded and not considered an entitlement. 3) The war effort took Americans to their highest peak of social cohesion. It’s at the second lowest point today. Only the American Civil War was lower. Try austerity today and you’ll see social unrest that makes 2020 look like a Girl Scout picnic.