

It's all about probabilities - what's priced in markets now?
It's all about probabilities - what's priced in markets now?
TMC #7! Markets are nothing else than a mechanism to aggregate a bunch of probabilistic scenarios and weigh them into one price: so, what are we pricing in today?
7 minutes, hopefully well spent
Good morning everybody!
If you like my work, would you please be so kind to share The Macro Compass around on social media and in your network? We already are one of the fastest growing macro newsletters out there with up to >1.5k subscribers in 20 days. No paid ads on Google to achieve this, just (hopefully) solid content.
But why not growing more by inviting other people to join this community?
In the end it’s free (and hopefully valuable) content.
Ok, I am guessing you follow me for the content so let’s kick off this week by looking at what our friend Mr. Market is pricing in.
That’s paramount important in investment decisions because we are never certain to have the right view beforehand.
So, how should one think about investments and different asset classes in a non-certain world? Well, simply in probabilistic terms and then assessing risk/reward.
The best trades tend to be the ones where:
1) Your probabilistic assessment of future potential outcomes was better calibrated than the average market consensus;
2) You found a good risk/reward expression of this divergence in views;
3) You let your profits run as the market was shifting its probability distribution towards yours.
In order to fulfill conditions 1) and 2), you need to know what the market is pricing. To do that, we can use several instruments. Let’s have a look!
The stock market
I am gonna use the S&P 500 here as a reference index, but you can do this analysis for any stock market with a relatively liquid underlying option market.
I believe there is no better overview of where the consensus lies than looking at where people have skin in the game: for instance, the option market.
Investors buying and selling options implicitly trade probabilities for certain outcomes to realize or not.
I am not gonna bore you with the theory behind these calculations, but the outcome is really interesting.
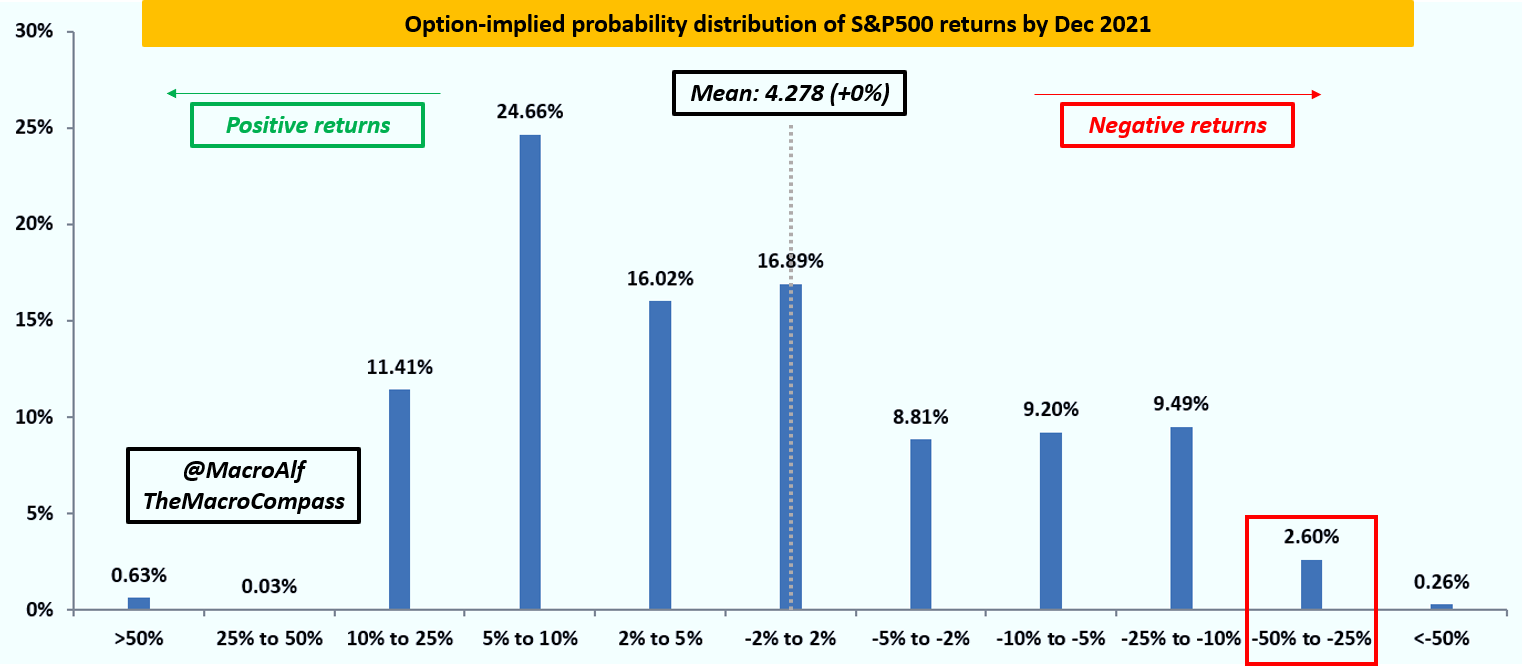
The option-implied probabilities for the S&P500 returns by Dec 2021 shows a mean return at +0% and an interesting distribution around this mean.
The most likely outcome according to option players lies in the +5/10% return area (with a 25% chance of that happening).
The chance of positive returns stands at 57% versus 43% chance for negative returns between now and year-end. So, how come the mean return is at 0% then?
That’s mostly because the negative return tail is fatter.
The market assigns a 2.86% chance of a 25%+ drawdown by end-2021 while it prices in a more meagre 0.66% chance of a 25%+ risk-on squeeze by Dec 2021.
So, option players in the S&P 500 expect a 57% chance of further positive returns by Dec 2021 with the base case (25% chance) being a +5/10% rally from here.
But they are also pricing a 3% chance of a 25%+ meltdown whereas <1% chance of a melt-up.
Do you think this probabilistic assessment is incorrect?
You can trade against it, but now you know exactly what the stock market is pricing in!
The bond market
For the bond market, I am again going to use the US as a reference but you can do this for any bond market with a liquid money-market curve (hint: almost all qualify).
Instead of the option market, we are going to use forward OIS rates. Omg, what the heck is that? Don’t be scared by the jargon and bear with me, it’s pretty simple.
OIS stands for Overnight Index Swap and it’s nothing else than 2 investors exchanging a fixed rate payment for a bunch of floating payment.
The bunch of floating payment reflects the overnight cash deposit at the domestic central bank - it basically represents the closest proxy for a risk-free overnight rate.
The fixed rate of the swap reflects the future expectations investors assign to where the central bank overnight deposit rate is going to be over the next years.
Forward US OIS rates tell us where investors price the Federal Fund rate to be xyz years into the future. Pretty cool, uh?
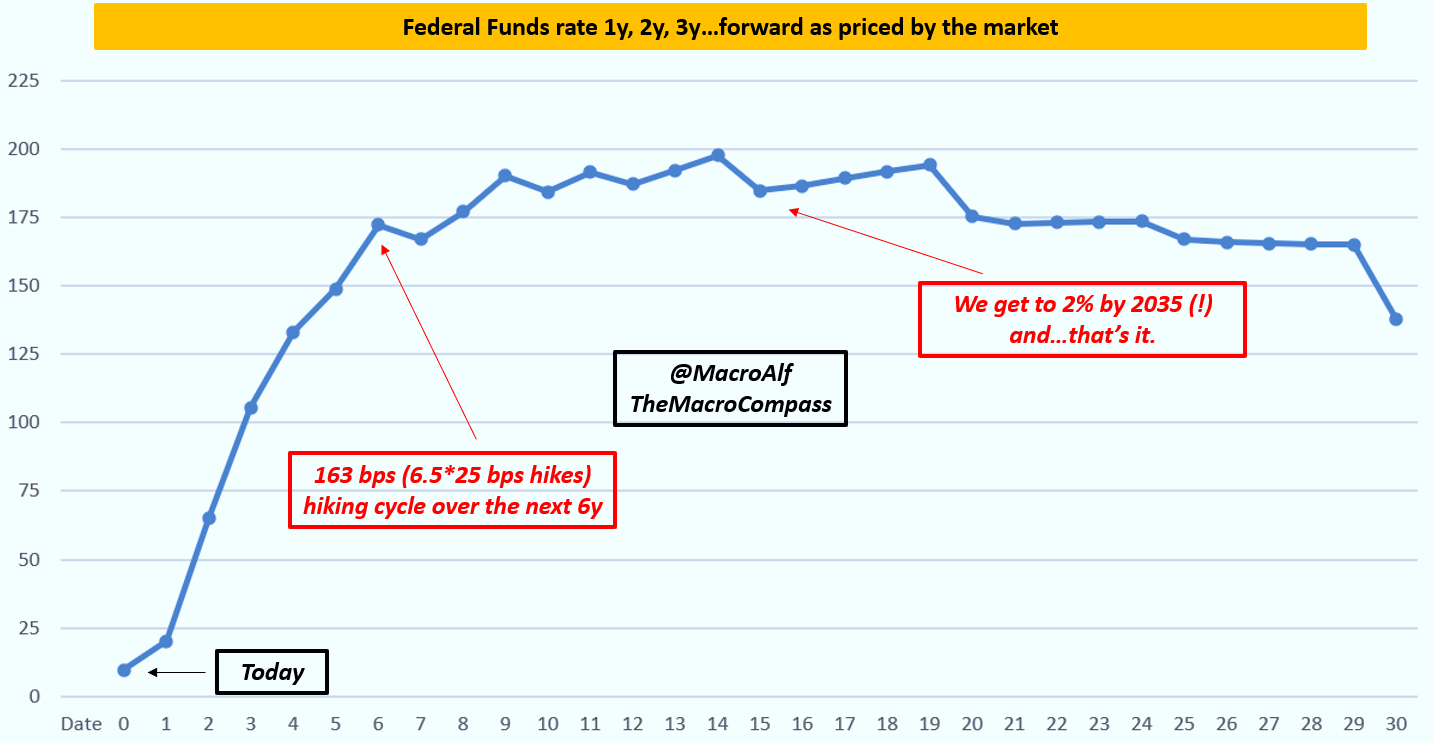
Here, the fixed income market participants believe the most likely outcome is:
The Fed goes for 25 bps hikes 6.5x over the next 6 years to reach around 1.7% FF;
1 hike in 2022, 2 hikes in 2023, 1.5x hikes in 2024, 1 hike in 2025, 1 more after;
Basically a plateau after reaching 2% Fed Funds rate.
Now, with all you know about inflationary pressures but perhaps also about long-term deflationary forces, do you agree or disagree with what the market is pricing here?
Again, you can trade this - perhaps you are right and the market is wrong.
But the first step is to know what are the odds you’re going against, i.e. what is the market pricing in?
A final note
If you made until here, you’re a proper hero. Well done!
If you like these topics, you might wanna have a look at Rishi’s Substack. He is very knowledgeable about fixed income and especially short-term interest rate markets. I definitely recommend paying a visit to his free newsletter!
If this is your first time reading The Macro Compass and you liked it, you can subscribe using the button below. It’s free content 2x a week directly in your inbox.
If you already subscribed, you’re the best!
But still, if you like my work I’d love if you could share The Macro Compass using the button below.
Hi Alfonso, your website is teaching me a lot- thank you! Does the pricing for long term UST yields basically tend to follow the cumulative Forward OIS rates for the corresponding time period e.g. UST 10y is basically al the forward OIS rates from 0 to 10 years? Thanks!
You are very informative!! I believe there are other factors that could be considered to derive a better result