The Macro Compass is trying to send you a clear message
TMC #2! The Macro Compass uses prop indicators for global credit impulse and changes in monetary policy stance to predict asset returns. It's now sending you a clear message.
If you follow me on Linkedin or Twitter, you will know I have continuously advocated to be long risk assets for the last 12 months. Sometimes my ambitious targets for the S&P500 attracted harsh skepticism, but we hit every single one of them on the way up.
For example, see here or here when I called for 20%+ returns in equities on a 9-12 months horizon and we ended up performing even more.
3 weeks ago I published a short piece on Linkedin advocating to lean long Brazilian equities (+8%), Russian equities (+7%), SPX (+2%), Oil (+6%) and Gold (+3%).
But the past is irrelevant, we have to manage our asset allocation looking forward.
So, how do I do that? I use my Macro Compass.
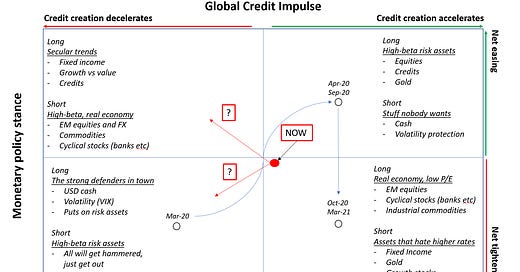
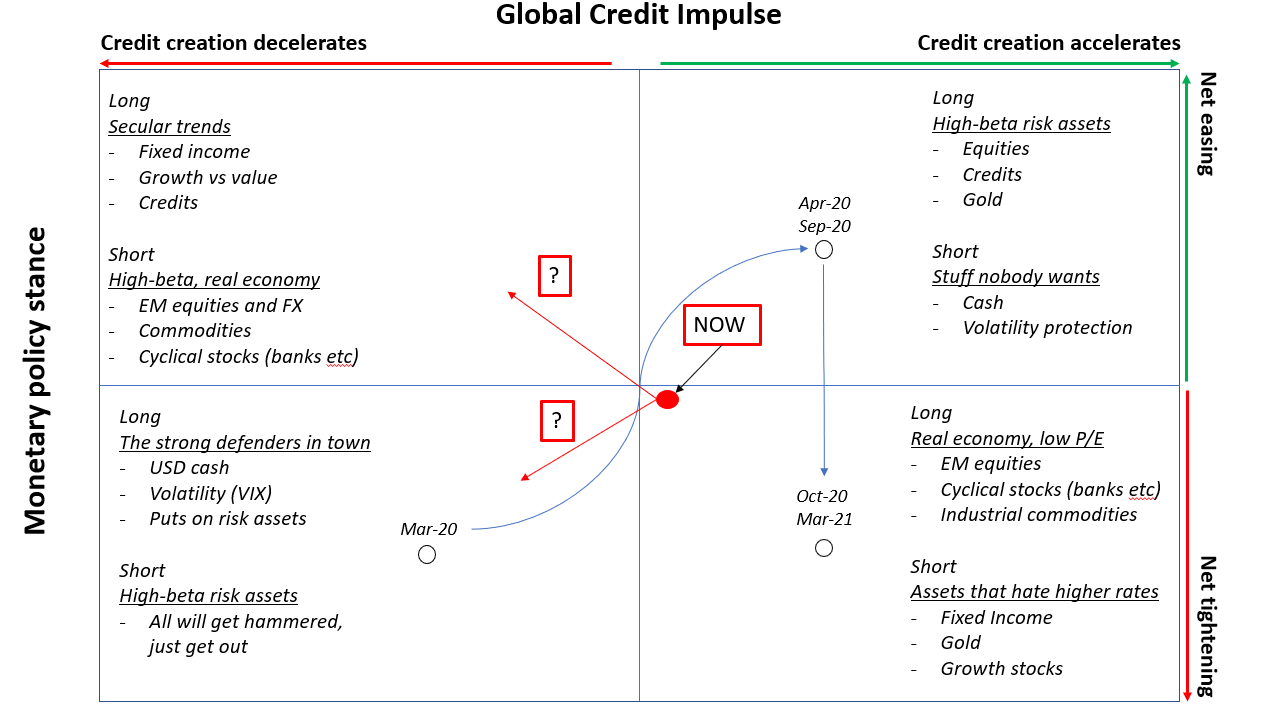
As you can see, the Macro Compass provides guidelines for asset allocation choices. Let’s look more into it. What are the two main drivers?
The global credit impulse
The global credit impulse is the pace of change of the flow of credit to the economy. It tells you whether the credit creation process is accelerating or decelerating. For the geeks out there, it’s the second derivative of credit growth.
Why does it matter?
Credit creation is the process of creating money out of thin air. Not bank reserves, but rather money that reaches the real economy and could be used to increase nominal economic activity. Governments create new money every time they spend more than they tax (persistent budget deficits) and commercial banks create new money every time they make a loan.
This newly created money reaches the private sector and fosters nominal economic activity with a time lag. Higher nominal economic activity => higher cyclical consumption and ‘‘better’’ fundamentals => higher earnings => positive risk assets. If the pace of change of credit creation turns negative => negative risk assets.
You don’t believe me? Take 5 minutes to listen to Ryland Thomas from the Bank of England on how money is created. Brilliant video.
There are no public sources where to gather real-time global credit creation data. I have developed my own prop model to track it.
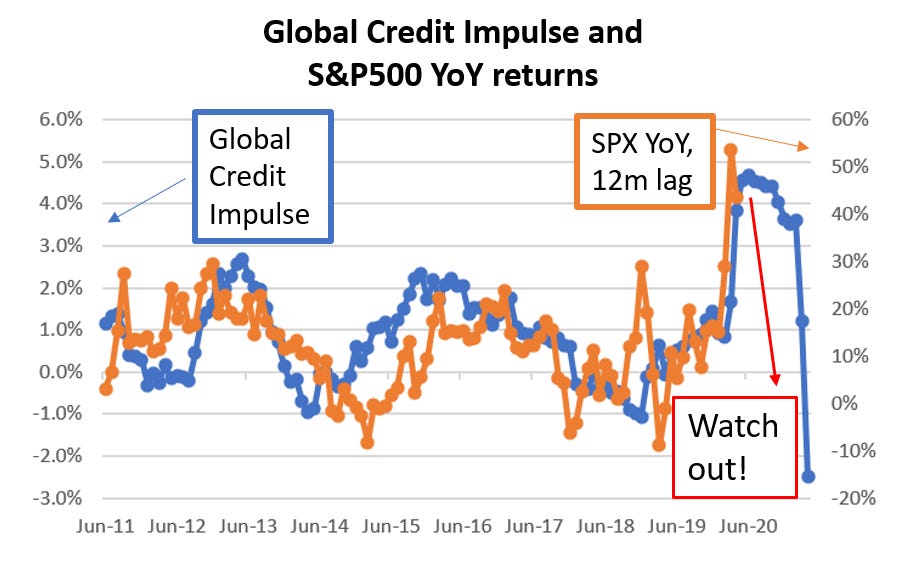
See for yourself how relevant it is for risk asset returns.
The 12m time lag can’t be applied to all risk assets. The global credit impulse tends to lead changes in bond yields with a 10m time lag or YoY industrial commodities returns by about 8m. But it does provide a pretty consistent signal for the broad risk asset spectrum.
The global credit impulse peaked around Jul-Oct 2020. On that metric alone, risk assets would run out of steam by Q4-21. Watch out.
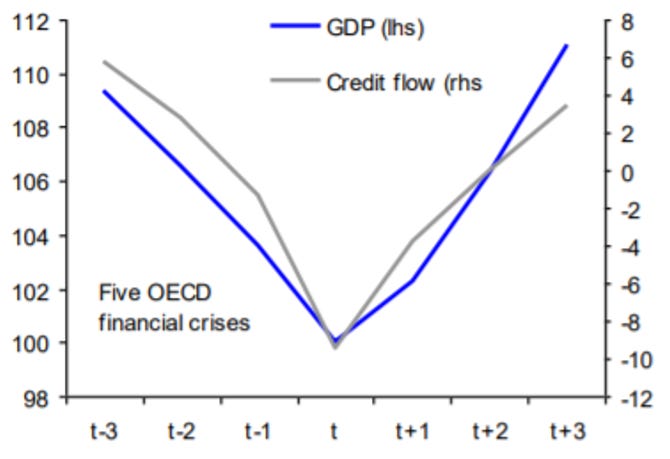
And how relevant it is also for forecasting nominal GDP growth.
The monetary policy stance
The second factor used to determine asset allocation decisions with the Macro Compass is the monetary policy stance.
To be precise, it’s about the pace of change in relative stance against neutral (r*, see TMC #1) and the pace of change in this stance against consensus expectations.
For the geeks out there, it’s again about second derivatives. The monetary policy stance might remain very accommodative in absolute levels, but if the direction of travel has moved to net tightening and it surprises consensus…ouch.
A good example of why this matters in the chart below.
In 2018, Powell allowed the pace of change in monetary policy stance to quickly move towards net tightening, and also surprising investors consensus with the ‘‘autopilot’’ remarks. 10y US real rates moved quickly way above the estimated equilibrium r* and guess what? Q4-18 equity market sell-off.
In early 2019, Powell performed the so-called ‘‘pivot’’ shift when he back-tracked from previous hawkish comments in 2018. 10y US real rates quickly moved to trade below r* and equity markets ripped higher.
It’s all about the pace of change and how that stands against consensus expectations.
During the ‘‘everything liquidation’’ C-19 market meltdown, real interest rates also moved abruptly higher as every asset was sold (including Treasuries) to raise cash and inflation expectations were clearly tumbling.
The Fed stepped in massively few days after. I guess they learnt the lesson.
So, where do we stand now?
Back to our Macro Compass.
In Mar-20, credit creation decelerated aggressively as nobody wanted to lend during a pandemic and the monetary policy stance had all of a sudden become very tight against current awful economic conditions and the ‘‘sell everything including Treasuries’’ move had abruptly increased real rates above r*. The perfect setup for the bottom-left quadrant: sell all risk-assets, keep USD cash, buy VIX.
Between Apr-Sep 2020, Central Bank stepped in by moving the monetary policy stance to very accommodative and positively surprising consensus expectations. Government-sponsored lending programs convinced banks to lend out and fiscal deficits were abundant, leading to a super strong credit impulse. You move to the top-right quadrant: buy everything, sell cash and vol.
Oct 20 - Mar 21 saw the first signs of the credit impulse feeding into real economic data and investor expectations about monetary policy stance had fully adjusted to the most dovish side of the spectrum, hence the relative stance became more neutral. This setup (bottom-right quadrant) is generally great for assets linked to the real economy and earnings growth rather than enjoying uber-low real rates and high valuations: buy real economy stuff, sell non-cash flow assets (fixed income at negative rates, gold, high P/E stocks etc).
Between April and May 2021 we have remained in the bottom-right quadrant, but it’s clear we are transitioning towards the left side as credit impulse has peaked and turned negative between July and October 2020 (remember: lag effect on risk assets between 8 and 12 months, generally).
I remain long selected EM equities (MSCI Brazil and Russia) and Oil here. Running my profits with tight trailing profit targets as the transition towards the left quadrant is undergoing and the relative monetary policy stance will matter.
Consensus expectations are for monetary authorities to embark in net tightening, but the pace of change matters: a small mistake and you move from top-left quadrant to bottom-left quadrant. And wow if that makes the difference.
Stay tuned and subscribe for updates!


If i remember correctly, it wasn't until March 10, 2020 then the market suddenly shifted to the bottom left according to your compass. Before that, from late Jan 2020 to March 9, the market has been stay in risk off sentiment at the top left?
We could see it very clearly via long-term Treasury price
Awesome post