Hi all, and welcome back on The Macro Compass!
From January 1st, getting access to this content (and much more!) will require a paid subscription.
As a loyal newsletter reader, you can sign up now and get access to the TMC services for the entire 2023 paying only 8 months instead of 12.
This offer is limited in both time and spots available.
You have until November 30th (10 days left) to be amongst the only 2,000 subscribers who will exclusively benefit from this offer (~750 spots left).
Check out which subscription tier suits you the most and take advantage of the exclusive offer here:
Intro
In this business, we are often inundated by countless news headlines telling us all about what’s happening…now.
It’s a never-ending process that invites market participants to spend time and energy dissecting how new information affects the investment landscape.
For a macro investor though, every now and then taking a step back is crucial: with a 30,000-foot view, the macro big picture becomes increasingly clear.
Hence, in this article we will:
Assess the structural trends underpinning our economic and monetary system, and how the 2020-2021 tectonic shifts interplayed with them;
Present our conclusions and discuss how the upcoming macro cycle is likely to play out.
The Macro Big Picture
Long-term economic growth is a function of the growth in labor supply and total factor productivity.
In other words: it’s highly influenced by how many people actively contribute to generate economic output, and how productive the labor force and the use of capital are.
Until the mid-80s, the ability to generate organic growth in most Western economies was very solid: a combination of strong working-age population and good productivity trends led to high levels of potential GDP growth.
But things rapidly took a turn for the worse in the late ‘80s.
By the early ‘90s, the post-WWII demographics boom had exhausted its positive effect.
Fertility rates decreased, longevity increased and hence the share of working-age population dropped by several percentage points in a few decades.
The number of people actively contributing to GDP growth wasn’t growing fast anymore - but perhaps an upward trend in productivity growth could offset this?
It could, but it didn’t.
Especially in the 2010s, productivity growth was relatively stagnant: we made some progress, but the marginal productivity gains were rather small and definitely not enough to push structural GDP higher given the demographics headwinds.
The permanent scars left by the Great Financial Crisis, and the capital misallocations that partially generated from monetary policy decisions such as the Zero Interest Rate Policies (ZIRP) and QE were amongst the many factors that acted as a drag on productivity growth.
Remember: long-term economic growth is a function of the growth in labor supply and total factor productivity.
After the ‘90s, as both demographic and productivity trends materially weakened so did the ability to generate structural economic growth amongst advanced economies.
Today, advanced economies are looking at potential real GDP growth in the 1.0-1.25% area (left chart) and required equilibrium real rates roughly around 0% for that to happen (right chart).
And given the demographics headwinds ahead, these numbers might well look even lower in the next 1-2 decades.
Low levels of GDP growth are socially unacceptable in capitalistic societies.
So, what’s the fix?
Debt.
Between 1990 and 2020, all major economies went ahead with an extensive use of credit in an attempt to cyclically boost economic growth way above its poor structural trend - Europe, Japan, US, UK, and even China saw their total economy debt as % of GDP rise from 100-150% to 300-400% in a few decades (left chart).
But if the underlying economic activity and wages don’t rapidly rise, how could these economies sustain such a massive build-up in leverage - especially private sector agents, which can’t print money to refinance or service their debt?
Easy: real yields were pushed lower and lower every time.
After all, if you make 100k/year you can probably afford a 400k mortgage at 4%.
At 2%, with the same 100k/year salary you can now take on 600k in debt.
The fix was ‘‘straightforward’’: more and more debt, at lower and lower real interest rates (right chart).
Can this go on forever?
There are three main elements that could disrupt this fragile and leveraged system:
A) Excessive levels of (private) debt;
B) Higher real rates;
C) Recessions and de-leveraging episodes.
The policymakers’ reactions to the pandemic led to a sharp increase in debt levels: public debt soared due to unfunded fiscal deficits, and in certain jurisdictions there was also a bump up in private debt due to government-sponsored bank lending to corporates and households - checkmark on A).
Gigantic injections of new real-economy money in the private sector (~$5 trillion in the US) coupled with re-openings led to a rapid surge in demand.
Bottlenecks in the global supply chain compounded the problem, and inflation skyrocketed and became broad and persistent over time.
This forced Central Banks to tighten policy and rapidly raise real interest rates - checkmark on B).
Tighter monetary/fiscal policies and higher real rates took a big toll on hyper-enthusiastic markets and the over-leveraged private sector slowly froze as borrowing costs became prohibitive for many businesses.
Many leading indicators are clearly pointing to a recession in 2023 - checkmark on C) on its way.
A trifecta of disruptive forces, all at once.
Are we looking at a regime change?
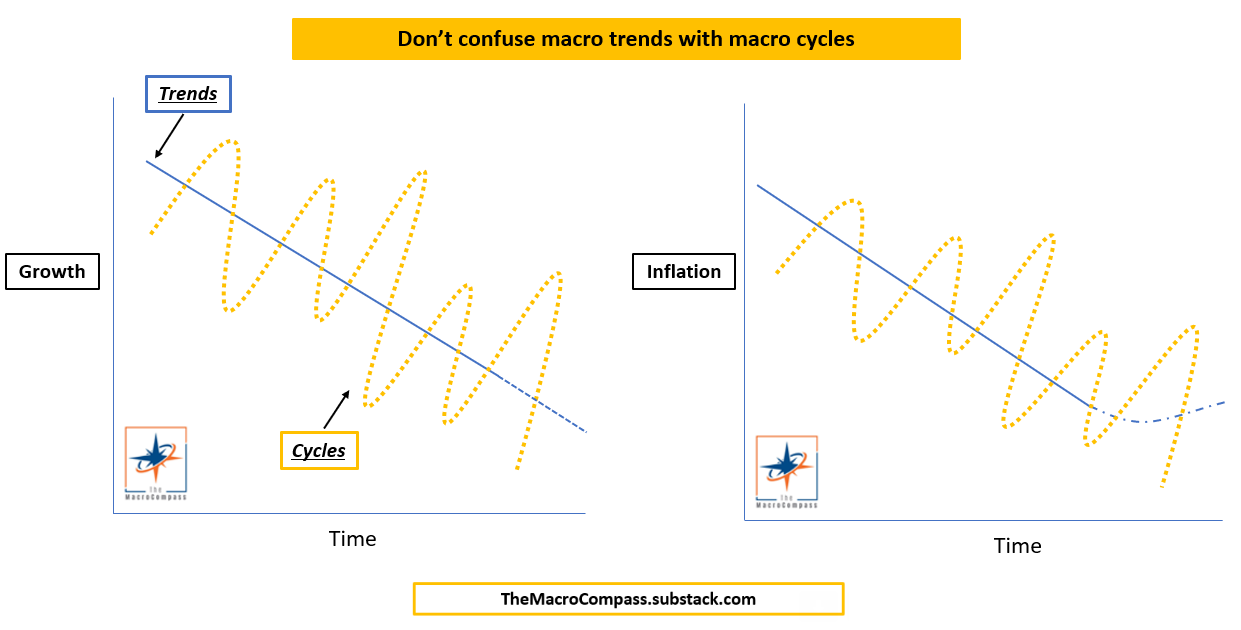
Conclusion: Cycles ≠ Trends
Over the last 30+ years, we have made extensive use of debt and lower rates to overlay cyclical growth boosts on the poor structural growth trends due to worsening demographics and stagnant productivity.
Recently, the pandemic and subsequent fiscal/monetary policy reactions have shaken the foundations of this very fragile system.
My assessment is that we are looking at a rapid turn in the macro cycle: from a strong nominal growth environment in 2021 to a disinflationary recession in 2023.
But when it comes to long-term macro trends, the story is different.
The secular disinflationary trend might take a marginal pause in the coming decade.
On the margin, these factors might contribute to a higher trend level of inflation:
The de-globalization process and onshoring of labor and supply chains;
The rapid decline of the (cheap, think China) labor supply growth ahead;
The concerted efforts and investments needed to transition to Net Zero Emissions
The secular trend down in growth has instead further accelerated, in my opinion.
Amongst other reasons, think of:
Higher levels of (unproductive) public and private debt;
Lower labor supply growth, and an ageing population;
Less global trades in a more polarized world
This leaves us with a slightly different long-term macro backdrop ahead: lower trend growth, higher trend levels of inflation.
Yet, the most notable change is not in long-term macro trends.
Instead, it’s in how more powerful macro cycles ahead will be.
Think of a pendulum: the swings around its resting position will get bigger.
As we will keep testing the fragilities of our leverage-based economic model, policymakers are likely to react more aggressively at each iteration: an even bigger QE, an even bigger fiscal stimulus, an even faster QT, an even more acute fiscal drag.
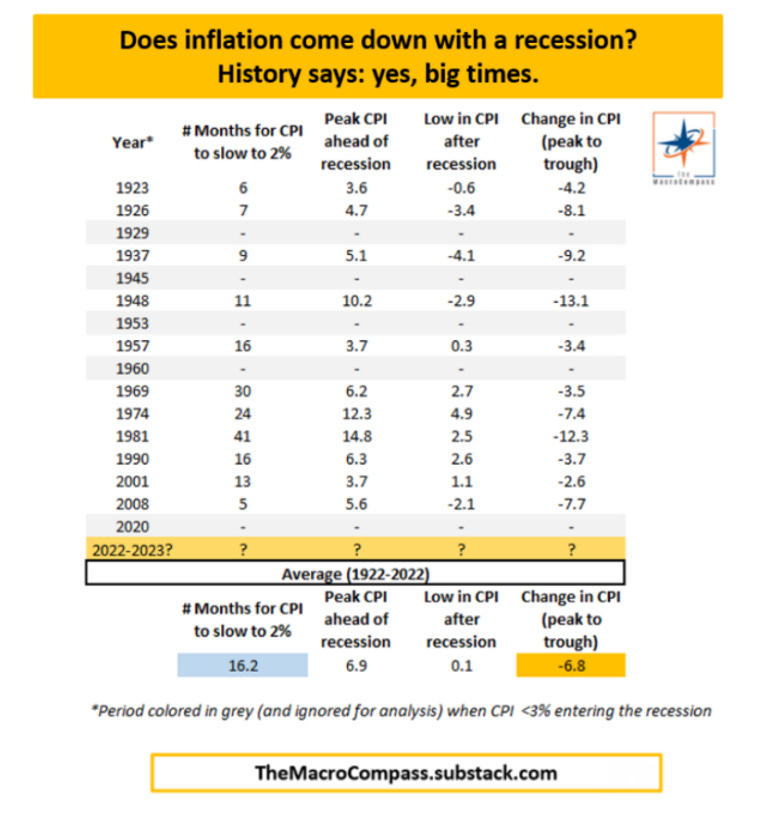
This is likely to cause more boom-and-bust macro cycles, like the one I expect for 2023: to bring down inflation quick, history teaches us we need a severe recession.
In the 2020s, wealth preservation will be much less about buy-and-hold and much more about macro risk management.
And this was it for today, thanks for reading!
If you enjoyed the piece, please click on the like button and share it with friends :)
Finally, a quick reminder.
From January 1st, getting access to this content (and much more!) will require a paid subscription.
As a loyal newsletter reader, you can sign up now and get access to the TMC services for the entire 2023 paying only 8 months instead of 12.
This offer is limited in both time and spots available.
You have until November 30th (10 days left) to be amongst the only 2,000 subscribers who will exclusively benefit from this offer (~750 spots left).
Check out which subscription tier suits you the most and take advantage of the exclusive offer here:
For more information, here is the website.
I hope to see you onboard!
DISCLAIMER
The content provided on The Macro Compass newsletter is for general information purposes only. No information, materials, services, and other content provided in this post constitute solicitation, recommendation, endorsement or any financial, investment, or other advice. Seek independent professional consultation in the form of legal, financial, and fiscal advice before making any investment decision. Always perform your own due diligence.


Share this post