


This is a free full-length piece available to everybody.
If you find it valuable, consider subscribing to the premium TMC service.
On the premium The Macro Compass platform, we do the hard work to deliver high-quality macro insights, tools and actionable investment strategy week in and week out.
Institutional-level macro strategy in plain English at a fraction of the cost.
Hi everybody, and welcome back to The Macro Compass!

The YOLO crowd is back with a vengeance.
Over the last month we have seen nearly bankrupt companies rallying 100%+ in a single day, and companies reporting awful earnings staging a 20%+ rally the day after.
In other words: YOLO is back, bro.
In this piece, we will:
Look back & quantitatively assess the mechanics behind this big Meme Rally;
Answer the big question: if bonds yields are rising and cash-like products now yield 5%, how on Earth is it that we are witnessing such a high-beta rally? And is this the start of a new bull market?
Let’s take a step back in time – precisely to early November 2022.
The leading narrative was that ‘’Powell is channeling his inner Volcker’’: as the momentum of core inflation kept increasing (orange), the Fed was revising their expectations for the terminal rate (blue) higher & higher.

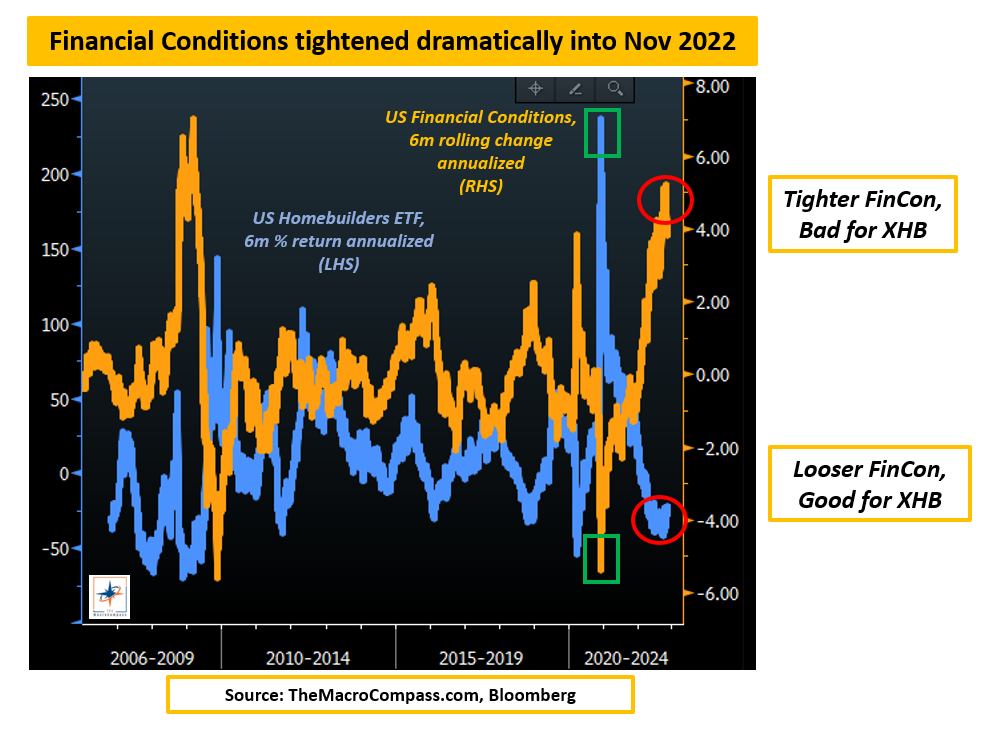
The Fed was all about tighter financial conditions, which is jargon for less animal spirits: a stronger US Dollar, higher borrowing costs and lower multiples.
Higher borrowing costs are lethal for very leveraged, interest-rate sensitive sectors like real estate, (unprofitable) tech and Meme/YOLO stocks.
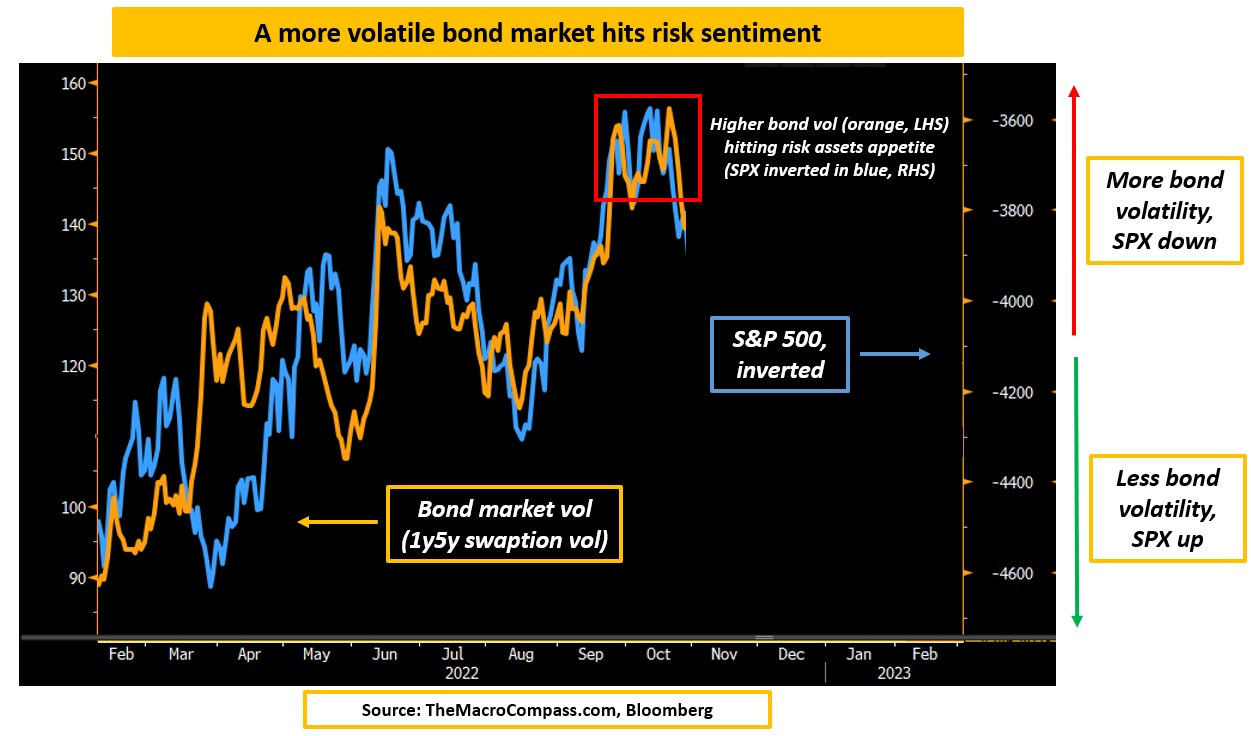
Not only that: uncertainty around the Fed terminal rate led to highly volatile bond markets.
Rising bond market volatility hurts risk sentiment as the backbone of many institutional portfolio (fixed income) doesn’t dampen overall portfolio volatility but instead contributes to it.
Hard to take additional risks in such an environment
But then, something abruptly changed.
We got a couple of ‘’disinflationary’’ prints, and before the recent revisions it even seemed that Powell’s preferred measure of sticky inflation (core services ex-housing) was decelerating on a trending basis.
On the backdrop of these disinflationary prints, the bond market staged a relief rally...
…and Powell didn’t fight back, at all.
And this is when the magic starts to happen: mechanical buying flows from leveraged investors kick in on a very large scale.
Here is how it works.
Commodity Trading Advisors (CTAs), risk parity and volatility-targeting funds often use volatility as one of their buying/selling signals: the more implied volatility drops and realized volatility keeps declining, the more these accounts can lever up and buy.
These mechanical flows can be very large – I estimate these systematic strategies could be easily lifting $1-2 billion (!) of US stocks per day, and the more volatility remains compressed the longer these buying flows last.

Why do these mechanical flows matter?
Their model-driven, valuation-insensitive nature has a disproportionate effect on two type of stocks:
The most shorted and hated stocks out there;
The least liquid and more flow-prone sectors in the market.
Think back in November: what sectors qualify for this definition?
Yes: homebuilders, Meme/YOLO stocks, unprofitable tech & co.
The short squeeze has been gigantic so far, and it’s well reflected in these two charts from Goldman Sachs.
Macro investors were caught very short Tech between November and January, and given the mechanical systematic buying flows we discussed above the need to cover shorts has been big.
Particularly over the last 2 weeks, the extent of short covering in Tech has been almost unprecedented.

To further validate this thesis, the worst performers in 2022 (left side of the quadrant) happen to be exactly the best performers of 2023 YTD (top side of the quadrant) with the YOLO guys standing out in the crowd.

Now, to the big question.
Our interactive Volatility-Adjusted Market Dashboard points to some interesting inconsistencies.
On a 1-month rolling basis, US front-end nominal rates have moved by over 2 (!) standard deviations and most importantly long-dated real yields trade above 100 bps – that’s quite a restrictive level.
The US Dollar is strengthening against most major currencies.
Bond, stock and FX implied volatility has stabilized and struggles to decline further.
Systematic vol-targeting accounts might have exhausted most of their buying needs, and yet…
…the Nasdaq and the Russell are 3-6% up over the last month.
Can this continue?

Look, there are two realities to face.
1) Markets can remain irrational longer than we can remain solvent;
2) Long-lasting bull markets require rapidly expanding valuations and/or strong earnings growth.
The Dot-Com bubble and the US housing market frenzy happened with Fed Funds around 5-6%, not 0%.
Animal spirits can be hard to contain, but the Fed doesn’t really have a choice.
After the recent revisions, core services ex-housing CPI (the sticky inflation) is still running at over 4% annualized levels and the US labor market keeps adding jobs at an underlying realistic pace of 150-200k new jobs per month.
The Fed will be forced to keep risk-free rates at 5%+ for 9-12 months at least, which means the housing market and the real economy must handle 7-8% (!) borrowing rates for a long time to come.
Hard to make the case for rapidly expanding valuations.
On the growth front, check this: between 2010-2020 we barely managed to produce an average 2% real GDP growth with an average Fed Fund rate of 0.62%.
What makes you sure we will avoid a medium-term recession with Fed Funds at 5%+ for long?
I will have fun staying poor, but I don’t YOLO here.
If you found this piece valuable, consider subscribing to the premium TMC service.
On the premium The Macro Compass platform, we do the hard work to deliver high-quality macro insights, tools and actionable investment strategy week in and week out.
Institutional-level macro strategy in plain English at a fraction of the cost.
For more information, here is the website.


Share this post