

Hedge funds are often called fast or smart money because they are one step ahead of herd market thinking.
I am blessed with the opportunity to have several of them as clients, and pick up their brains on what they are watching in markets and what the next big macro trade might be.
In this piece, I will share with you 5 macro developments and charts hedge funds are watching.
1. Are you watching the deflationary tails?!
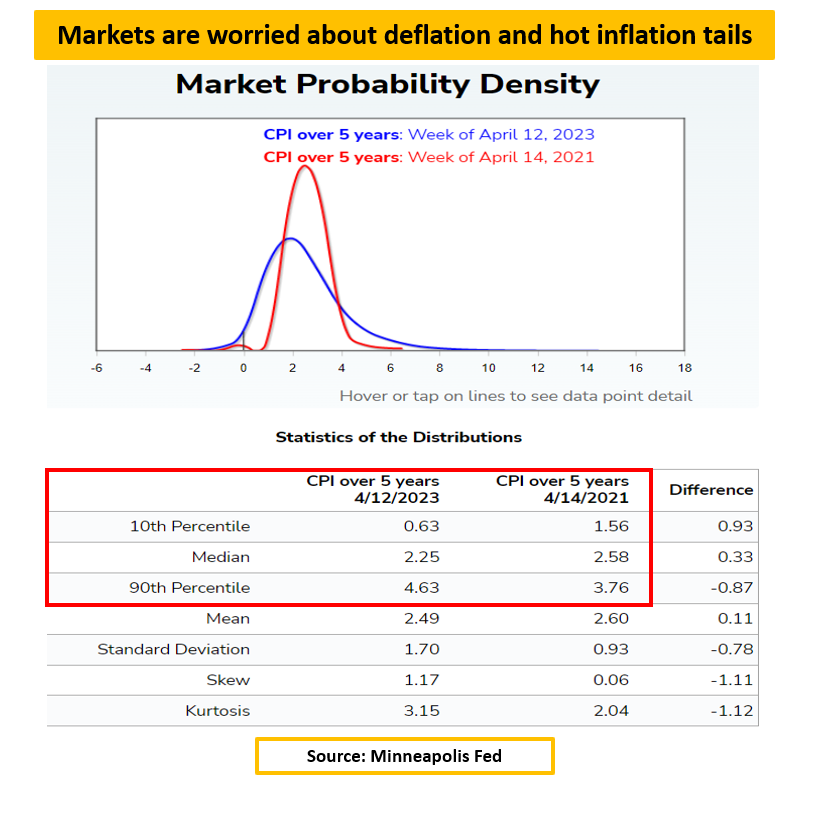
The Minneapolis Fed runs an excellent algorithm that plots the market-implied distribution for 5-year ahead expected inflation in the US (here).
It uses options on inflation-linked products to determine what investors are expecting as base case, and what they are willing to pay for upside (hot inflation) or downside (disinflation) in US CPI over the next 5 years.
If we compare today’s distribution (blue) versus 2 years ago (red) we notice that the median base case for investors is that US inflation will average around 2.25% over the next 5 years: quite a comfortable sight.
But the devil is in the (de)tails.
While 2 years ago the 10th percentile of the distribution settled at 1.56%, today is sits at 0.63% - quite close to actual deflation.
The ‘’hot inflation’’ tail (90th percentile) is also a bit higher at 4.63% vs 3.76% in 2021.
While the base case for inflation ahead is very benign, today investors are more worried about tails than they were in 2021.
And in particular deflationary tail risks are staging a comeback.
2. Bond market volatility: look under the surface…
As the banking crisis was unfolding, bond market volatility literally exploded: the cost to hedge against an abrupt Fed cutting cycle skyrocketed, and bond market liquidity quickly evaporated.
Lately, as we find out the world is not coming to an end anytime soon bond market volatility is quickly receding…but are we out of the woods?

This chart shows the 3-month market-implied volatility in US 2y rates (orange, RHS) and 30y rates (blue, LHS).
Bloomberg users can find the tickers here: USSN0C2 BGN Curncy and USSN0C30 BGN Curncy.
If you don’t have Bloomberg, you can find and chart these tickers on our Volatility-Adjusted Market Dashboard (tickers: US 3m2y Swaption ATM Vol, US 3m30y Swaption ATM Vol).
This chart is interesting because it shows that while front-end bond market volatility (orange) receded but remains elevated, the long-end (blue) seems to be much less uncertain about future outcomes.
Why?
As this hedge fund client eloquently puts it: the Fed can have a strong influence on 2y rates, but 30y rates are rather based on investors’ expectations and uncertainty about future growth and inflation.
And there is not much to be uncertain about there – the Fed is on a mission to kill growth and inflation, 30y rates know it and you never fight the Fed.
Which brings me to the 3 most crucial charts hedge funds are watching to find the next big macro trade, and that you should care about too.
Let’s dig in…
Eager to read the remaining part of this macro report?
Come join The Macro Compass premium platform to get access to Alf’s full-length timely pieces, actionable investment strategy and much more!
Check out which subscription tier suits you the most using the link below.
For more information, here is the website.


Share this post