


‘‘Buy land, they’re not making it anymore.”
Mark Twain
The real estate market is likely to experience a short-term slowdown in 2022 amidst its intact long-term bullish trend.
While its dynamics seem to be somewhat unpredictable, in this piece I will argue that both the short-term and long-term path for house prices depend on some clearly identifiable drivers: inflation-adjusted mortgage rates, real wages, supply/demand imbalances, and demographics amongst others.
The idea is to provide you with the tools to understand and navigate the biggest asset class by market cap in the entire world: the real estate market.

Without further ado, let’s jump right in!
The Drivers Behind the Most Systemic Market in the World
Actually, before we jump right in. If you are struggling to keep up with all the good macro newsletters out there, I get you.
But the guys at Harkster.com have a handy solution: they created a fantastic newsletter aggregator that allows you to keep track of the ones you like, and find brand new ones to read.
I am using Harkster myself, and you can also check out which macro newsletters I am reading!
Back to it: do you know what’s the biggest market cap asset class in the world?
Equities? No.
Bonds? No, try again.

The real estate market is by far the biggest asset class in the world: summing up residential and commercial real estate with agricultural land, at the end of 2020 the estimated market value of the global real estate market was at $326 trillion or about 40% bigger than the global bond and equities markets combined!

Ok, now that I have your attention let’s talk about the drivers of the most systematic asset class in the world.
House prices can be essentially thought of as the price of a long term inflation-adjusted bond, whose coupons depend on inflation-adjusted long term mortgage rates and the ability to service those depends on the trajectory of real wages.
Additionally, other factors like regulation, demographics and temporary supply/demand imbalances can affect house prices but we’ll cover them later.
About 70% of real estate transactions across the world are backed by mortgages: this percentage fluctuates depending on the ‘‘health’’ of the market - in a bear market like 2009, there were virtually no cash buyers while in a long bull run you’ll find more.
Mortgage origination is nothing else than the commercial banking sector printing new money (see here on how it works) and crediting your account with the funds necessary to buy the house: the trick is that you as a private individual can’t print money, so you need to be able to service this debt with your wage over time.
Inflation eats away your liabilities but also your wage, hence we will look at long term inflation-adjusted mortgage rates and real wages.
First: real mortgage rates.
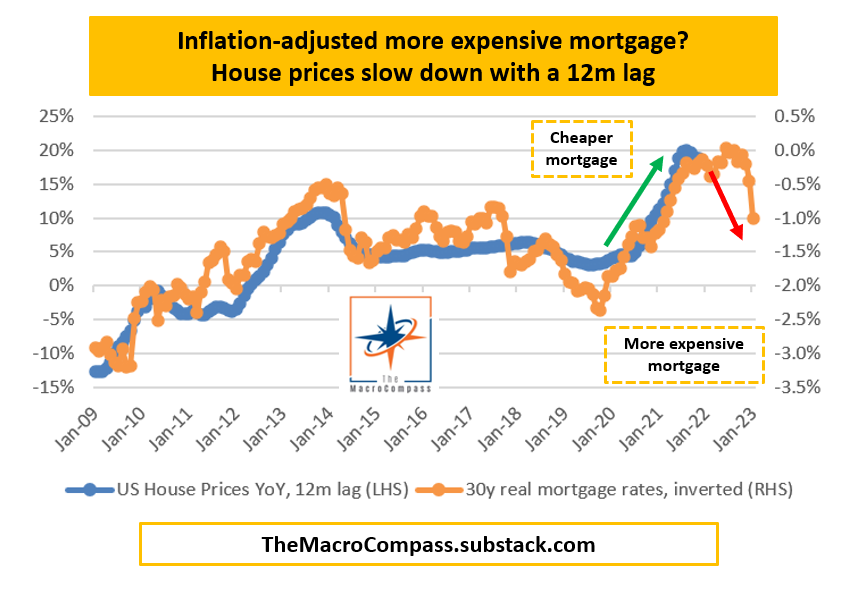
The chart above shows US 30y mortgage rates adjusted for consumer inflation expectations (right-hand side and inverted, in orange) versus US house price YoY change, lagged by 12 months (left-hand side, in blue).
Changes in real borrowing costs for the private sector affect YoY changes in house prices with a lag: a more expensive mortgage (2018) slows down the house price appreciation process, while a cheaper mortgage (2021) gives a boost to the long-term structural bullish trend in real-estate.
Inflation-adjusted 30y mortgage rates abruptly became more expensive by about 1 percentage point over the last few months as nominal mortgage rates increased from 3% to 4% while consumer inflation expectations remained unchanged around 3%: this alone would justify a short-term slowdown in house price YoY changes in 2022.
The short-term unfriendly trend is compounded by weak developments in real wages.
After all, if your real mortgage costs increase but your inflation-adjusted salaries are increasing too…you can still afford purchasing the same house at the same price.

Unfortunately, real wages are down -3% on a YoY basis while the monthly mortgage payment required to be the US median house spiked up as both mortgage rates and house prices increased at the same time over the last 6-12 months.

Finally, a word on the supply/demand imbalance.
Plenty of attention is paid to houses under construction as an indicator for upcoming supply, but I believe the correct way to look at supply is housing starts adjusted for population. Plenty of houses are labelled as ‘‘under construction’’ due to shortages in components and tight labor supply, but have most likely already found a buyer before the recent spike in 30y mortgage rates.
Housing starts adjusted for population are a less polluted metric of upcoming real estate inventory coming to the market, in my opinion.

On this front, we are still way below the 2006 housing starts mania when adjusted for population size but the housing starts per capita are increasing.
As a recap:
House prices can be proxied as the price of long term inflation-adjusted bond, whose coupons depend on inflation-adjusted long term mortgage rates and the ability to service those depends on the trajectory of real wages;
Short-term: inflation-adjusted mortgage rates spiked up and real wages are contracting;
On top, housing starts/capita are not crazy-like-2006, but they are picking up.
In 2022, the real estate market is likely to experience a short-term slowdown.
But its long-term bullish trend remains intact: let’s quickly see why.
Long-term, Long Real Estate
Remember: house prices can be essentially thought of as the price of long term inflation-adjusted bond, whose coupons depend on inflation-adjusted long term mortgage rates and the ability to service those depends on the trajectory of real wages.
As argued in my most-read piece The Macro EndGame, lower real interest rates are not a bug but rather a feature of the current monetary system in place for 50 years.
Our economic system produces poorer and poorer long-term economic growth due to low population growth and stagnant productivity, and this is socially and politically unacceptable. Hence, we continue to leverage up: by creating new money (credit), we bring forward future consumption and boost a wealth illusion effect.
Equilibrium real interest rates to service this increasing leverage and keep the system afloat are lower, and lower, and lower at each cycle.

The cheaper the borrowing costs for the marginal buyer, the easier it will be for the asset price / wealth illusion cycle to continue: previous asset owners feel ‘‘richer’’ and new asset buyers feel they can ‘‘afford’’ more expensive houses.
Their real wages are moving up very slowly, but incremental leverage is accessible at super cheap real borrowing costs!
The housing market sits at the epicenter of the wealth illusion mechanism representing >50% of the global aggregate market cap, and it also feeds important second-round effects when it comes to consumer sentiment and spending: if the market value of your personal balance sheet increases, you are likely to feel more comfortable about spending and perhaps investing too and vice versa.
As the structural tailwinds behind the long-term downward trend in real interest rates remain, real wages moderately increase over time and the incentive scheme for policymakers not to derail but rather feed the steady long-term wealth illusion mechanism remains in place…
…the bullish long-term trend for real estate is likely to extend further, with the first major structural hiccups once real mortgage rates can’t markedly drop anymore.
Conclusion
In 2022, the real estate market is likely to experience a short-term slowdown in its long-term bullish trend.
While the analysis focuses on the US market, you can easily extend it to your domestic housing market applying the same principles.
House prices can be proxied as the price of a long term inflation-adjusted bond, whose coupons depend on inflation-adjusted long term mortgage rates and the ability to service those depends on the trajectory of real wages.
Short term, as inflation-adjusted mortgage rates spiked up and real wages are contracting for more than a year plus housing starts per capita are picking up, the real estate market is likely to experience a slowdown.
Long term, as the structural tailwinds behind the downward trend in real interest rates remain, real wages moderately increase over time and the incentive scheme for policymakers not to derail but rather feed the steady long-term wealth illusion mechanism remains in place…
…the bullish long-term trend for real estate is likely to extend further, with the first major structural hiccups to appear only once real mortgage rates can’t markedly drop anymore or real wages materially drop for years.
Thank you for making it all the way through! :)
If you enjoy my work, please consider clicking on the like button and share the article.
Are you looking for any other kind of partnership or collaboration?
Are you an institutional investor who likes The Macro Compass and would be interested in a bespoke, pro-to-pro coverage?
For any inquiries, feel free to get in touch at TheMacroCompass@gmail.com.
If you want more macro insights, you can also follow me on Twitter and Linkedin.
See you soon here for another article of The Macro Compass, a community of 27.500+ worldwide investors and macro enthusiasts!


Share this post