Soft landing, no landing at all, banking crisis leading to an immediate recession.
Chinese reopening yes, reopening no.
S&P 3850, 4200, no again 3850, wait it’s back up to 4150.
Push & pull macro and market dynamics dominated Q1, leaving investors confused on how to approach Q2.
This is why in this piece we will:
Quickly review Q1 through the lenses of Volatility-Adjusted market performance across asset classes;
Refresh the key variables behind our quantitative TMC Asset Allocation Model;
Reflect on asset classes valuations and conclude with our ETF Portfolio allocation to kickstart Q2.
For long-term macro investors, Q1 brought mildly positive returns with a truckload of volatility and went away without marking the start of any major macro trends.
Reminding ourselves that US cash equivalent products yield ~5%, there was little to be excited about.
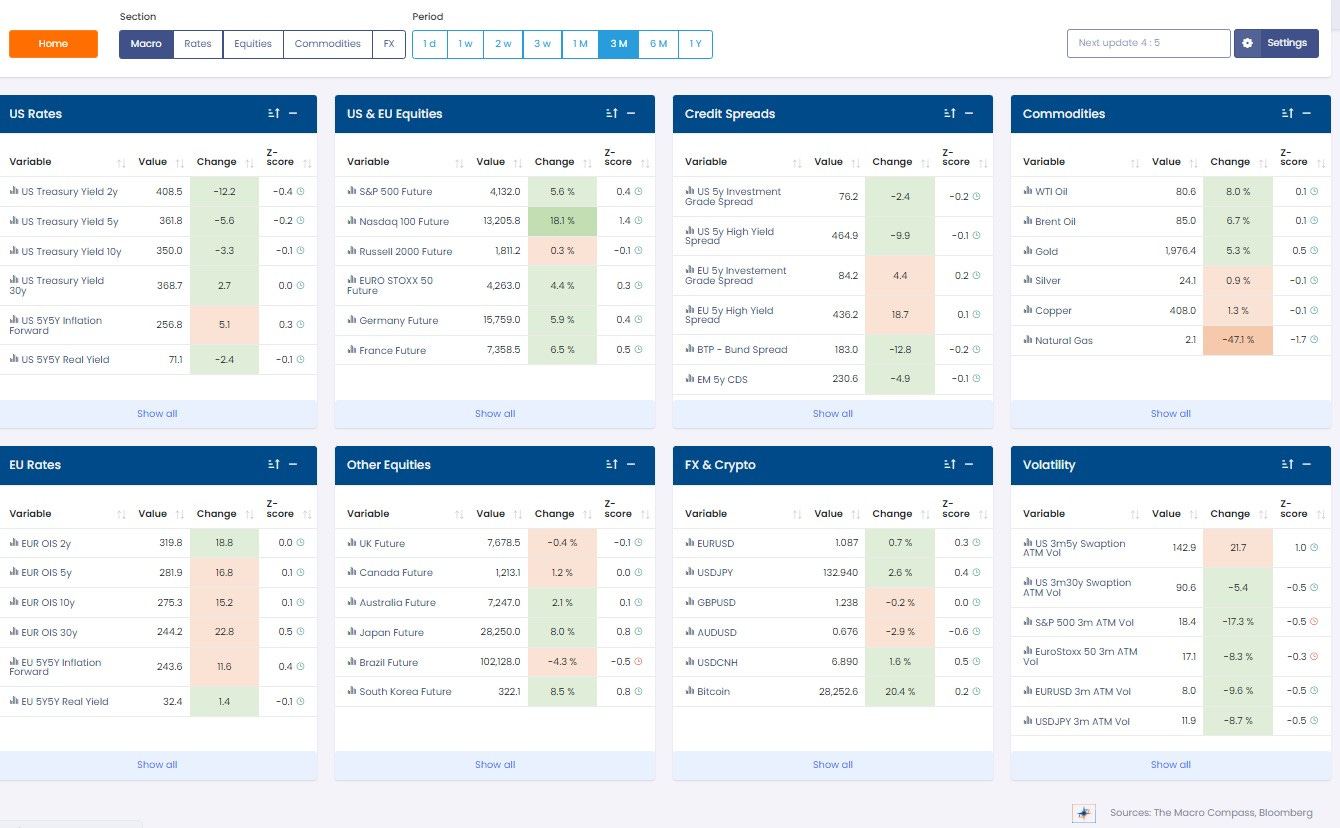
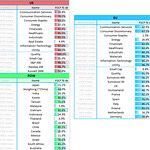
Our Volatility-Adjusted Market Dashboard (VAMD) screens global macro asset classes returns from a risk-adjusted performance, and it shows a 3-month Z-Score <1 for most assets = no major vol-adjusted action.
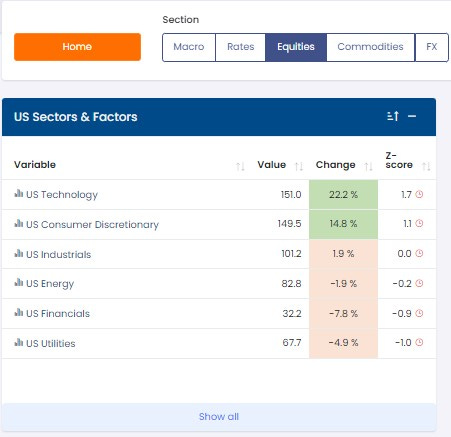
Rather than in being outright long or short a certain asset, the most significant Q1 macro trend was a rotation in US equity sectors.
Tech and Consumer Discretionary largely outperformed defensive sectors like Healthcare and Utilities.
But why?
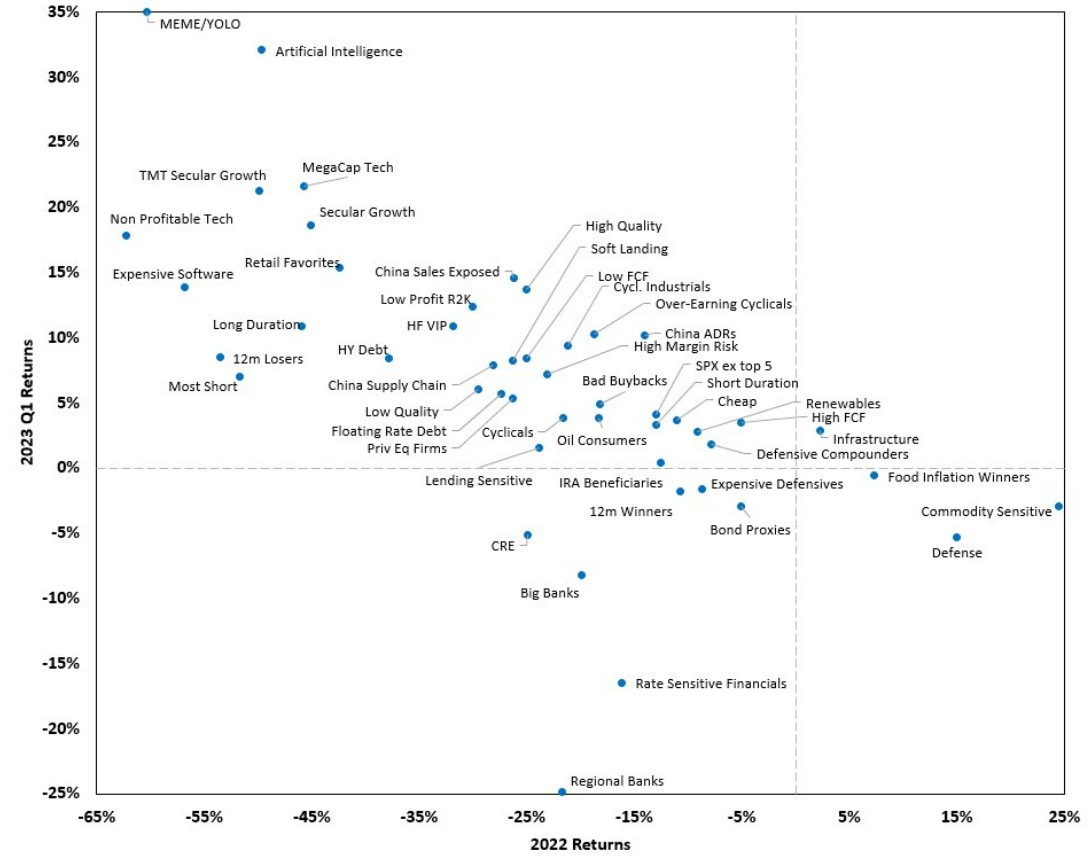
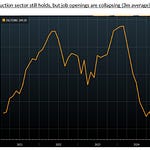
This excellent chart from Goldman explains why: mechanical re-leveraging flows, not fundamentals.
Back in November, Powell was channeling his inner Volcker – no end in sight for the hiking cycle, and the most hated assets in such macro environments are high-beta, unprofitable tech/meme companies.
Fast forward to early 2023: disinflation first and a more prudent Fed after the SVB saga bring in systematic flows and ‘’pivot buyers’’, leading to a massive short squeeze.
Nothing to do with fundamentals, but a good reminder to respect the power of macro-insensitive flows.
So, with that in mind how do we approach Q2?
First: the macro fundamentals.
The TMC Quadrant Asset Allocation Model (QAAM) blends together monetary policy and economic growth indicators to identify the prevailing Macro Quadrant and hence the most appropriate asset allocation tilt.
It combines that with an assessment on valuations, correlations and portfolio volatility to come up with the final allocations depleted in the Long-Term Macro ETF Portfolio.
The Y-Axis of our QAM tells us the global monetary policy stance remains tight due to elevated and sticky real yields, and about to get tighter as the flow of financial money turns more negative.
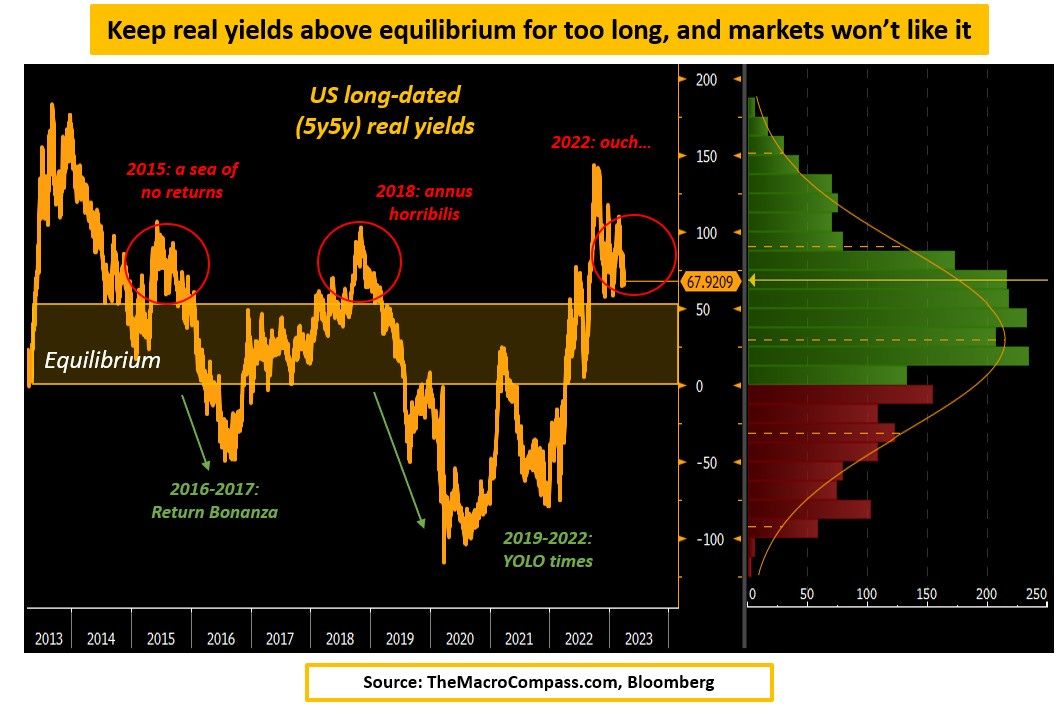
Long-dated real yields are now positive and above equilibrium in many jurisdictions, and that is negative for growth and markets as our debt-based system struggles to roll over cheap leverage.
In the US, sustained periods of above-equilibrium real yields lead to poor market performance (2015, 2018).
In 2022, it was the rate of change in real yields that scared markets: going from the -0.75% March YOLO levels to the +1.50% October ‘’Powell = Volcker’’ levels in only 6 months required tectonic adjustments in valuations.
Since then, real yields have stabilized but have averaged a tight +0.93% for 6 months already.
In Q2, real yields are likely to remain in tight territory again.
And markets don’t like tight conditions, especially if they last for a long period of time.
Ok.
But what are we really doing QT or are Central Banks printing money?
How does that affect macro and markets in Q2, and how to best position portfolios?
Let’s dig in…
Eager to read the remaining part of this macro report?
Come join The Macro Compass premium platform to get access to Alf’s full-length timely pieces, actionable investment strategy and much more!
Check out which subscription tier suits you the most using the link below.
For more information, here is the website.





Share this post