


The S&P 500 has recently tested the 4,200 area after rallying all the way from the lows seen in late 2022.
With the Fed probably delivering its last rate hike in May and the US economy staying clear from a recession so far, investors are grappling with a key question.
Are we looking at a new bull market or is this just another (looong) bear market rally?
In this piece, we will:
Discuss the prospects for earnings growth and valuations;
Assess the current stage of risk premia for equity markets around the world;
Present some historical parallels and conclude with our assessment on the stock market for 2023.
We are often fascinated with the S&P 500 price as a barometer of short-term risk sentiment.
As a macro investor though, buying stocks means taking a view on the stream of future cash flows (earnings) the company will deliver and the price (valuation) you find reasonable to pay for them.
So, let’s start from earnings per share (EPS) prospects in 2023 and beyond.

As the table from Earnings Whispers shows, this week companies worth over $10 trillion will report earnings.
The big bang is late next week with Apple’s earnings on Thursday followed by Friday labor market data.
So far, ~25% of S&P 500 companies reported earnings with 68% beating consensus: strong, right?
My career in banking taught me to take analyst consensus with a pinch of salt and rather focus on what really matters: are earnings rising, at what pace and how broad is the positive/negative momentum?
Equities have been a negative carry trade since summer 2022, and they will likely continue to be one.
Let me explain what I mean.
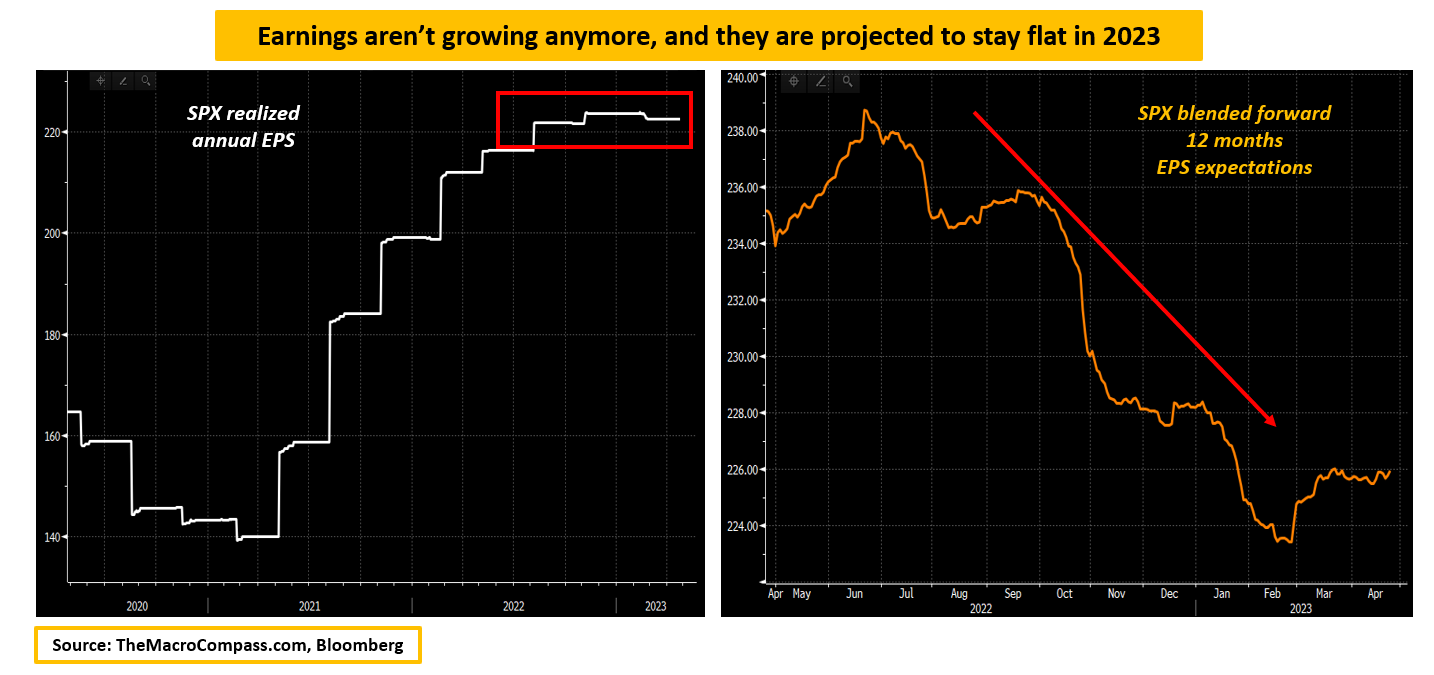
The chart on the left shows the realized S&P 500 annual earnings per share: it currently sits at $223.
Since mid-2022 though the momentum of earnings growth has clearly stalled around the $220 area, and the expectations for future 12-month EPS growth has collapsed from the $240 to the $225 area.
In other words, investors that were buying equities since mid-2022 were:
‘’Promised’’ a 8-10% EPS growth over a 12-month period ($238 expected EPS in 12 months versus $220 spot earnings), and saw these expectations being slashed back to almost 0%;
Delivered no actual earnings per share growth in almost one year.
When deploying capital, stock investors expect a future stream of above-consensus growing earnings.
When actual cash flows are strong and above market consensus, equities are a ‘’positive carry’’ trade as investors are handsomely paid to sit in the stock market.
Since last year, the inverse scenario unfolded: realized earnings were weak, and future EPS growth expectations have been slashed.
As risk-free rates are now in the 5% area, equities are a negative carry trade.
Nevertheless, negative carry trades can still make money – how?
Valuations expansion, or simply people willing to pay more to be in the trade.

The S&P 500 rally from the late 2022 lows has been almost completely driven by multiples expansion: as the green arrow shows, the 12-months forward P/E moved from 16x to 18.5x pretty rapidly as the disinflationary trend started and the Fed removed some of the ‘’Volckeresque’’ uncertainty from markets.
The question now is: what about future earnings, valuations and risk premia?
In other words: is this a new bull market or just another bear market rally?
Let’s dig in!
Eager to read the remaining part of this macro report?
Come join The Macro Compass premium platform to get access to Alf’s full-length timely pieces, actionable investment strategy and much more!
Check which subscription tier suits you the most using this link or the button below:
For more information, here is the website.


Share this post