
Hi everybody, and welcome back to The Macro Compass!

Economic data is surprising on the upside, and markets are busy trying to digest what this means for the Fed.
Terminal rates are now priced well over 5% in the US and now around 4% in Europe, and bond traders are quickly dismissing all cuts in 2023 too.
So, have we avoided a recession for good and how resilient is the global economy to higher interest rates?
The answer to this question will be vital for portfolio performance in 2023.
Hence, in this piece we will:
Discuss the recent upside surprise in macroeconomic data – how resilient is the global economy?
Dig deep into Dr. Yield Curve – what’s this PhD in economic telling us now?
Conclude with our assessment and portfolio construction going forward
Recently, macro data has been surprising on the upside: retail sales, PMIs, housing data all look better.
And this is why.
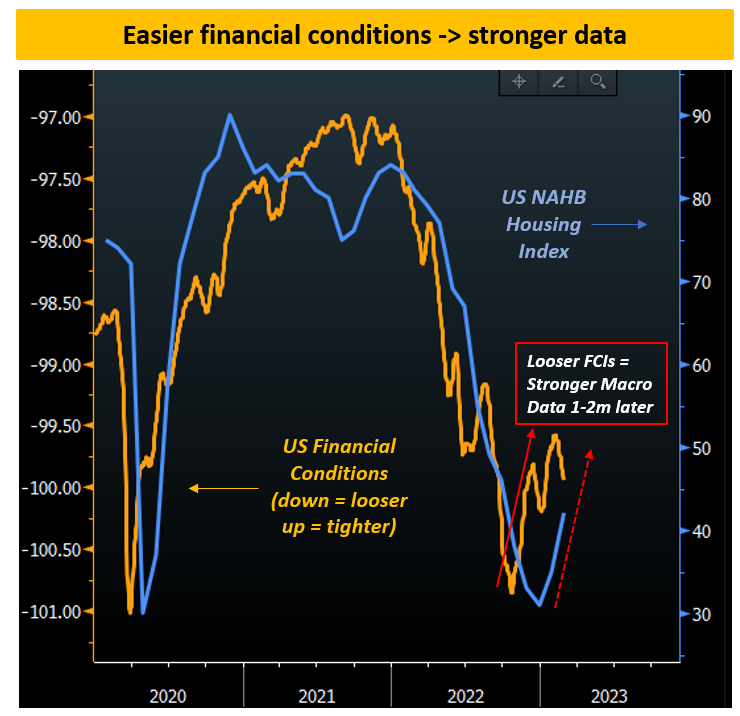
US financial conditions have materially eased from November to early February.
A sharp loosening of financial conditions is often associated with an improvement in macro data with a 1-2 months lag.
The chart above proves the point: the US NAHB Housing Index (blue, RHS) readily responded to looser financial conditions (orange, LHS) with a small time lag exactly like it did in 2021 and 2022.
The mechanism is easy to understand: lower interest rates and easier access to credit allow more home buyers to step in, hence leading to improved sentiment in the housing market.
Looser financial conditions also help companies and consumers via cheaper access to leverage, higher equity prices and a weaker USD and hence feed into better PMIs for instance.
Should we expect further upside surprises in economic data?
For soft indicators (e.g. PMIs) the lag is pretty short, while coincident indicators (e.g. labor market, industrial production) take a little longer to react – March might bring some more positive news…but.
Financial conditions have aggressively tightened again in the last two weeks.
And March data releases cover February data, where the major seasonality boost from January could reverse.
The January Non-Farm Payroll numbers were boosted by a much lower amount of post-holidays seasonal layoffs than usual – February NFPs (released on March 10) could disappoint if seasonality trends reverse.

So, further upside surprises or not?
Lack of conviction is the name of the game recently.
We went from pricing a 40-50% chance of a near-term recession in December to pricing away all 2023 Fed cuts in early February.
The results of this poll are very telling – I asked FinTwit whether they’d buy or sell 30y Treasuries here.
Over 13,000 people replied and basically they have no clue.

I am showing you this so you can zoom out.
In this business we are often overwhelmed with information – or rather with noise, I should say.
This is why I like smoothing macro data: it allows me to take a step back from the noise of daily data and ever-changing narratives and have a panoramic view.
So, let’s:
Look at the big picture for macro data;
Ask the PhD in economics Dr. Yield Curve a couple of questions;
Conclude with our assessment and portfolio construction going forward
Enjoyed it so far and eager to read the remaining part of this macro report?
Come join The Macro Compass premium platform to get access to Alf’s full-length timely pieces, actionable investment strategy and much more!
Check out which subscription tier suits you the most using the link below.
For more information, here is the website.


