


Hi all, and welcome back on The Macro Compass.
Last call: there are only 53 spots (9%) left to secure your heavy discount for the TMC Bond Market Course!
As a loyal TMC reader, there is an exclusive offer for you: using the coupon ‘‘BOND500’’ at checkout you can claim a chunky 25% off!
You can watch the course and download the material anytime you want, but this exclusive offer won’t be there forever :)
Not many spots left, so be quick and take advantage of it offer before it sells out!
For more information, you can visit this dedicated page.
The ECB Policy Mistake
The ECB hiked interest rates to 4% and I think they made a policy mistake.
Lagarde keeps throwing fuel on the fire as the European economy is already feeling the tightening much harder and faster than the US: but why?
This is a function of ECB tightening but also of the fact that the European private sector enjoyed amazingly cheap borrowing rates for so long – and hence the change of tune is felt much harder.
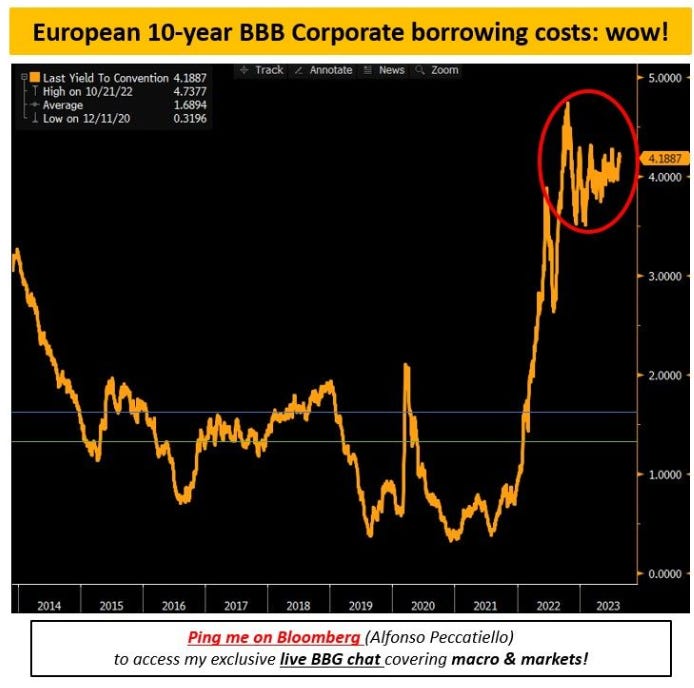
Have a look at the chart below which shows European BBB 10-year corporate borrowing costs from 2013 to today:
- 2013-2023 average: 1.69% (blue line)
- 2016-2019 average: 1.35% (green line)
- Today: 4.20% (!!!)
European BBB-rated corporates could borrow for 10-years at 1.69% (!) all-in cost on average between 2013 and today – that’s the blue line on the chart. If we focus on the pre-pandemic period, between 2016-2019 that average was 1.35% only (green line).
Today, life is much harder: borrowing costs have almost tripled (!!!) to 4.20% and most importantly they have been sitting there for almost 12 months now.
That’s a serious tightening of borrowing conditions which is biting into the European economy pretty hard.
Yet the ECB keeps hiking and it also ignores another macro beast threatening Europe much more seriously than the US: refinancing cliffs!

The chart above shows the % of corporate loans and bonds maturing per each calendar year per different jurisdictions.
As corporates spread out their borrowing over time, refinancing needs are not all clustered together: on average companies have to refinance about 10-15% of their entire borrowing needs each year (red line).
As you can see, Europe (blue) faces a tough task next year: European companies will need to refinance 25% (!) of their borrowing needs in 2024 and they will have to do it at borrowing rates which are much higher than what they are used to.
As the refinancing cliffs approach fast in Europe, companies have to take hard decisions: stay away from leverage and shrink their businesses altogether, or cut structural costs (e.g. jobs) to maintain a viable business despite higher borrowing rates.
The ECB just hiked in the face of an already weak economy facing sizeable refinancing cliffs: I think Lagarde just made a policy mistake.
Japan Matters for Global Bond Markets
In a recent interview, Bank of Japan governor Ueda signaled the era of negative interest rates in Japan might soon be over.
As a result, currencies and bond markets were on the move.
But why does Japan matter so much for global bond markets?
Japanese investors are amongst the biggest capital exporters in the world, and they have become gigantic buyers of US Treasuries, European fixed income and other foreign bond markets.
As domestic yields have been depressed for so long and Japan kept accumulating savings and foreign reserves, it looked for ways to invest these abroad to generate higher returns.
For reference, Japanese investors alone own over $1 trillion of US Treasuries and some EUR 400 bn in various European bonds (mostly French and German).
Now that domestic yields in Japan might be on the rise, will they stop investing in foreign bonds?

Here is the thing: they have already done that.
The Japanese support for global bond markets has been fading for quarters already.
But if Japanese bond yields have just started to rise, why did this happen already quarters ago?
You see: when Japanese investors buy foreign bonds they must swap existing JPY for USD or EUR.
This means they would run FX risk too which often they don’t want – from my personal experience speaking to Japanese investors in my previous job, they hedge the FX risk between 3 and 12 months which is considered a large enough period of time to assess the risk/return of their bond investment after hedging FX risk.
The chart above shows you what a Japanese investors see when looking at investing in 10-year US Treasuries after the costs for hedging USDJPY for the next 12 months.
For Japanese investors, today US Treasuries are extremely expensive to own because FX hedging costs are super high (Fed rate hiking cycles versus no BoJ hikes) while curves are inverted and hence the yield benefit in investing in foreign 10-year bonds is dramatically reduced.
US Treasuries are the most expensive in decades for Japanese investors.
They have been so for quarters now.
And the next BoJ action will be crucial to determine whether this trend continues.
Is Powell Done Hiking?
US inflation surprisingly accelerated in August: what does this mean for the Fed?
The Fed splits core CPI into:
1️⃣ Goods inflation
2️⃣ Housing inflation
3️⃣ Services ex-housing inflation

Disinflationary forces are notoriously at play for goods: overhang in inventories (e.g. car industry) and a complete healing of supply chains point to a continued moderation in core goods prices.
This is also reflected in stuff like the Adobe Price Index measuring online digital goods prices which just hit a 40-month low.
Housing inflation represents a large share of the core CPI basket and the Fed got quite some good news with this report.
Rent of shelter keeps decelerating sequentially as it just lags what's happening to rent inflation on the ground: the Zillow rent growth series has dropped materially and housing inflation captured in the CPI statistics is following suit.
The pace of the deceleration is great news for the Fed: the 3-month annualized housing inflation rate is now down to 4.6% from a peak of almost 10% (!) at the beginning of the year.
It should continue to slow down going forward: good news for Powell!
What about Powell’s preferred measure of sticky inflation - core services ex-housing?
This is supposed to be the stickiest, output-gap, labor market slack related part of the CPI basket which Powell watches the most closely.
We got a 0.4% MoM print which was stronger than expected, but the chart above allows us to take a step back and look at the trend in sticky inflation: the 6-month annualized rate of change hit a new low in this cycle at 2.7% down from over 5% (!) at the beginning of the year.
Sticky inflation seems to be getting under control too.
All in all, the Fed seems to be done with hiking but markets are starting to challenge this assumption: higher oil prices, pressure building in bond markets and a solid monthly print in core services ex-housing all bring questions to the table.
Calm before the macro storm?
Last call for the TMC Bond Market Course: there are only 53 spots (9%) left to secure your heavily discounted price!
As a loyal TMC reader, there is an exclusive offer for you: using the coupon ‘‘BOND500’’ at checkout you can claim a chunky 25% off!
You can watch the course and download the material anytime you want, but this exclusive offer won’t be there forever :)
Not many spots left, so be quick and take advantage of it offer before it sells out!
For more information, you can visit this dedicated page.


Share this post