

Our economic system is ultra-financialized and dependent on leverage.
That’s why understanding the incentive scheme for both investors and borrowers is an important step to piece the global macro puzzle together.
Real yields play a crucial role in that puzzle.
Rule #1: you can’t calculate real yields by subtracting today’s inflation from long-term interest rates!
The right formula to calculate real yields is the following:

From a borrower’s perspective, real yields represent the expected inflation-adjusted borrowing costs to take on more debt and leverage.
Why do real borrowing rate matter more than nominals?
That’s because as a borrower if you pay 3% nominal interest rate on your debt but you expect inflation and your cash flows to grow by 4% per year, servicing your debt burden won’t seem that scary.
It’s about future inflation, not today’s - and that explains the formula above.
Real interest rates matter for borrowers because they inform them on the expected inflation-adjusted cost they will face when taking on more debt and leverage.
From an investor’s perspective, (risk-free) real yields represent the safest layer of inflation-adjusted returns they can make and hence set the bar for everything else.
If you can make 5% real risk-free return per year, your appetite to go and YOLO into some unprofitable tech name will be much lower.
If real yields are negative, you will be looking for alternatives to deploy your cash much more aggressively.
Real yields play a big role in influencing investor’s asset allocation preferences.
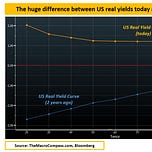
Here is a stunning chart: the US real yield curve today (orange) against 2 years ago (blue) - the curve is derived using Treasury Inflation Protected Securities (TIPS) for different maturities.
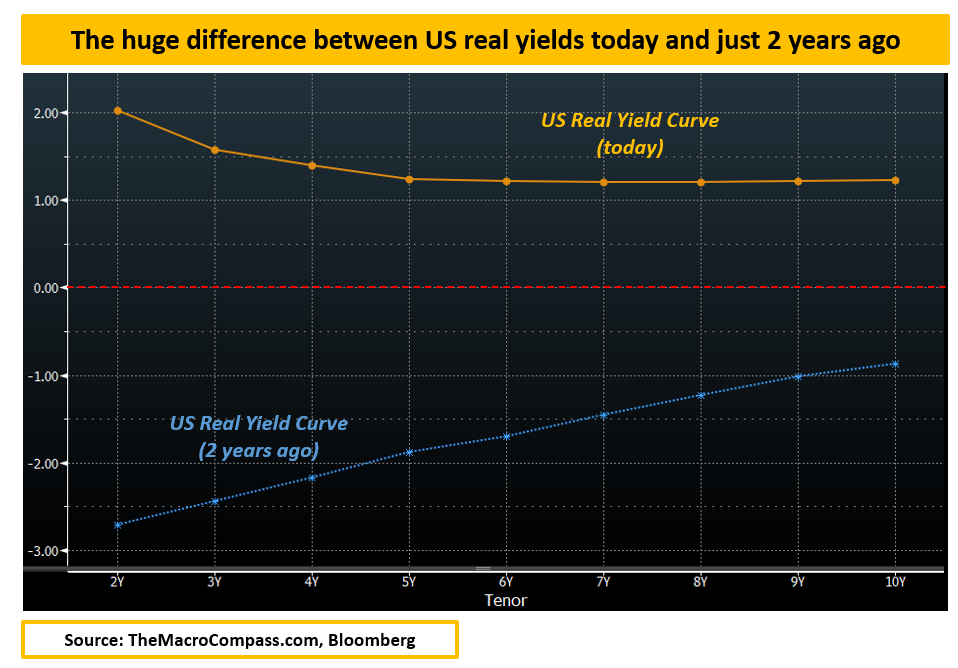
In 2021, US real yields were deeply negative and projected to remain so for the next decade (!).
Borrowers had the best time of their life as they could lock in extremely cheap inflation-adjusted borrowing costs, and investors were charged with negative real yields for the ‘‘luxury’’ to own risk-free government bonds.
Back then, it was all about TINA (there is no alternative): you have to get involved in risk assets at whatever valuations, and you have to go a step further before the herd does so - buy altcoins and unprofitable tech stocks, sell it to the next guy coming.
The absolute level and the rate of change in real yields are important drivers of stock market valuations.
As the chart below shows, if long-dated real yields are negative (blue, LHS) for a prolonged period of time people will at some point be happy to pay 30x forward P/E (!) to pile up in the S&P 500.
We used 5-year forward 5-year real yields to isolate market expectations in 2021 for where US real yields would have been between 2026 and 2031.

In 2022 the Fed changed its mind, and Powell started to worry about inflation and hiked rates aggressively - he even explicitly mentioned real rates multiple times as he wanted to see them in positive territory.
A sharp increase in real yields (blue, LHS) led to a rapid drop in stock market valuations (orange, RHS) in 2022.
As soon as investors were actually given an alternative through positive real rates on risk-free Treasury bonds, they understood there was no reason to pay frothy multiples for equities.
A rapid change in real yields affects markets behavior, and a persistently positive or negative level of real yields slowly affects investors’ preferences over time (positive real yields = less appetite for risk assets and vice versa).
But real yields also matter a great deal for economic growth.
Because real yields are so important for borrowers and providers of capital and our economy functions smoothly when there is balance between the two, let’s define a crucial macro concept: equilibrium real yields (r*).
R-star is the equilibrium real rate at which our economy functions smoothly and delivers its potential GDP growth without overheating or falling into a recession.
The younger, more productive and less indebted our economy is the higher r* is.
Unfortunately weaker demographics, stagnant productivity and a big burden of debt have lowered the equilibrium real rate at which our economies can smoothly function.
Today, estimated r* is at 0.00% - 0.25% in the US and at -0.50% to -0.75% in Europe.
R-star is a theoretical equilibrium real rate, but we can observe where real yields are actually trading in markets - and hence we can estimate whether markets are forcing the economy to work with real yields which are higher or lower than equilibrium.

The chart above shows a 20+ year history of US 5-year real yields minus equilibrium real rate r*: if the series records a negative level Fed policy was loose (real yields < equilibrium) and if the series moves in positive territory the economy was forced to function with real yields > equilibrium.
Notice how every time real yields were sitting above equilibrium, something broke in the economy and in markets (2001 recession, 2008 GFC, 2018 stock market).
To the contrary, periods when real yields were below equilibrium were generally good for growth and markets (2004-2007, 2012-2017).
Real yields are the lubricant of our credit-based economic system, being the balancing mechanism that drives decisions for borrowers and providers of capital.
They are therefore also an important driver of investors’ asset allocation preferences and economic growth.
Enjoyed this educational macro piece?
Well, you are going to love what comes next :)
In my upcoming TMC Macro Course I will unpack the bond market like it’s never been done before - in plain English, and from a practical perspective.
I will share my knowledge and data sources with you so that you can master this complex but systemically important market.
The course will be launched in a few weeks, and subscribers to The Macro Compass get hefty discounts (from 25 all the way to 50%!) - what are you waiting for?
Check which subscription tier suits you the most using this link or the button below:


Share this post