

Hi all, and welcome back to The Macro Compass!
A warm thank you to the numerous readers who immediately decided to use the early bird discount and secure their spot for the macro learning journey together in 2023.
As a reminder, in this recent piece I announced that from Jan 1st, 2023 The Macro Compass will graduate from a newsletter to a comprehensive macro platform.
This content will become much more frequent and be enhanced by macro courses, interactive tool, model portfolios and much more.
As a newsletter reader, you can sign up now and get access to TMC services throughout 2023 at a 20% discount using the code ‘‘TMC’’ at checkout - it’s applicable for all tiers.
The offer is valid for another 17 days and there are ~1,200 spots left.
Check out the website and available products here.
Do you remember July?
Here we are again: left to assess whether we are looking at a bear market rally or a sustainable turning point for the stock market.
Last week’s softer than expected inflation print spurred a massive rally across asset classes: the 60-40 portfolio posted one of its strongest 2-day performances ever, precious metals zoomed higher while the US Dollar took a beating.
The magnitude of the market reaction was exacerbated by technical reasons we will discuss, but to assess medium-term implications we need to break down the CPI report and take a broader look at the global macro puzzle.
Hence, in this article we will:
Decompose the latest CPI report looking at the drivers behind the surprise, with a particular focus on the inflation features the Fed is the most interested in;
Contextualize the markets’ reaction, taking into account cross-asset signals and keeping an eye on lessons from the past;
Look at Long-Term ETF portfolio implications and tactical trade ideas that could be considered going forward.

A Breakdown of The CPI Report
Core CPI came in at a monthly pace of 0.27% for October 2022, the lowest monthly print since summer 2021.
When it comes to inflation, growth and other macro drivers here on TMC we prefer looking at momentum rather than one-off prints: this helps smoothen volatility and seasonality, and Powell told us he’s looking at inflation the same way with a particular focus on the 3-month moving average.
Here is how it looks like now:

Using this momentum metric, we are still far from levels consistent with 2% YoY core inflation (see 2017-2018) but the pace has undeniably slowed down from its peak.
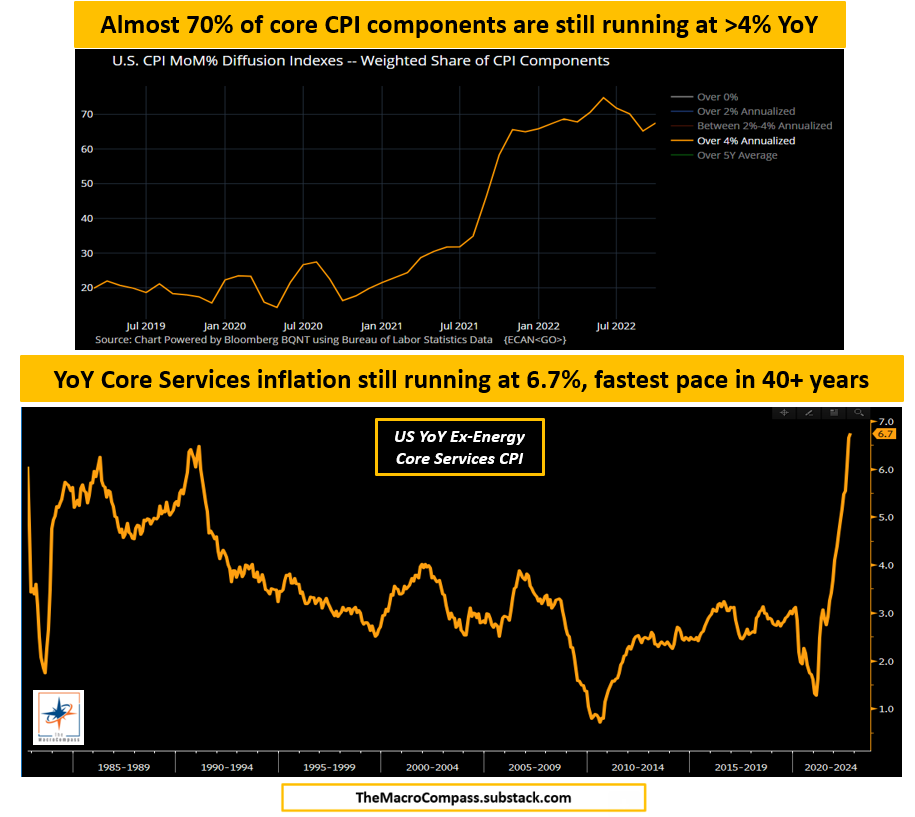
As we had two false positives in late 2021 and mid-2022, it’s worth looking into the underlying drivers and the breadth of this inflation surprise - the Fed is also very attentive to how broad inflationary pressures are.
The biggest negative contributors of the core CPI print were goods (especially transportation, i.e. used cars) and medical care services, while the most positive topline contributor was shelter inflation.

The positive news is that goods disinflation is finally here - and it was about time.
The transition from a pandemic, goods-centric world to a post C-19 services driven economy and the decongestion of global supply chains will ensure further weakness in goods prices.
The NY Fed Global Supply Chain index is now sitting at only 1 standard deviation away from its long-term mean: we are not totally out of the woods yet, but definitely making progress there.

The less positive news is that almost 70% (!) of core CPI components still run at above 4% annualized inflation rates, which makes inflationary pressures still broad.
And most importantly, as shelter inflation lags house prices and on-the-ground negotiated rents it’s very unlikely its monthly pace will markedly slow down before ~6 months from today.
Ex-energy core services CPI is running at 6.7% YoY, the fastest pace in over 40 years.
Going forward, as goods disinflation accelerates and the momentum of core services inflation stabilizes we should expect MoM core CPI prints to range around 0.3-0.4%.
That implies YoY core CPI will be slowly trending down towards 4% by June 2023: a welcome development, but still way too high for the Fed to feel at ease.
By the end of 2023 though, my models point towards a rapid drop in inflation at or below 2% coupled with a likely earnings recession.
The very negative Global Credit Impulse print in July 2022 leads YoY CPI by 5 quarters and it therefore suggests a major downtrend in inflation and nominal growth in Q3-Q4 next year.

On the inflation front, we can expect only partial good news going forward followed by a rapid disinflationary trend in the second half of 2023.
But that second leg will be also associated with higher unemployment rate and an negative EPS growth.
In other words, a recession.
How did market react to the CPI print?
Let’s take a look.
The Celebratory Rally Explained
Think about this.
After the softer than expected CPI print, the GS Unprofitable Tech Index rallied 25% in two days and the 60-40 portfolio had one of its best 2-day streak ever.
The market exploded higher across the board.
But while the extreme bond market reaction can be somehow rationalized, the equity market rally was also due to technical reasons.
The downward surprise in CPI led to a decline of US inflation expectations, with 1-year forward 1y inflation now priced at only 2.65%.
Despite the outsized front-end rally, market-implied real Fed Funds rate ahead (e.g. my Powell Credibility Indicator) remain comfortably high.
Coupled with terminal Fed Funds still priced in the 4.9% area, this provides context to the bond market move: it was very large, but it leaves fixed income pricing within the realm of acceptable outcomes for the Fed.

The equity market rally was instead much more pronounced and mostly driven by technical and institutional reasons.
Let me explain.
As I’ve run institutional money, I am very familiar with these incentive schemes: money managers’ annual compensation is largely dependent on bonuses that are mostly paid as a % of calendar year (over)performance.
In 2022, you either traded very well being prudently short risk and made a killing through October or you traded poorly and you are now hoping for a quick turnaround.
In the first case, your incentive is to protect your hard-earned bonus: your downside is a face-ripping Nov/Dec bear market rally that wipes out a lot of your P&L and hence your bonus. You will likely buy upside exposure to the market and chase it higher.
In the second case, your job is anyway at risk and you can only hope for a quick turnaround at year-end: your incentive scheme is also to buy convex structures benefitting from an outsized bear market rally that could save the day.
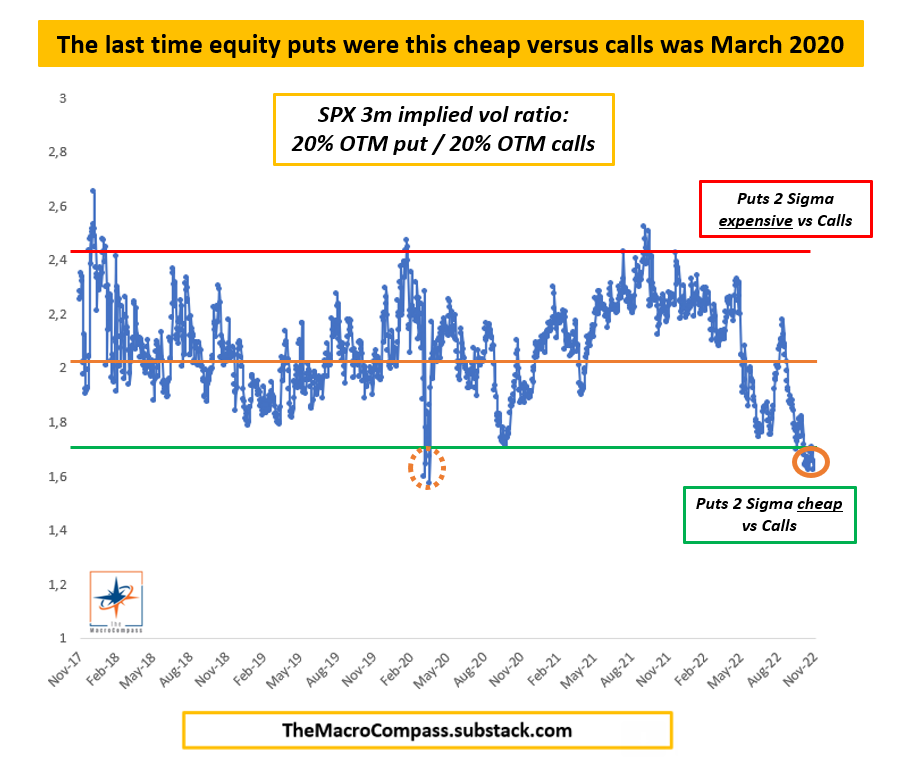
This phenomenon is easily captured by the skew in 3-month S&P500 options: the implied volatility of 20% out-of-the-money puts has never been this cheap relative to the implied volatility in 20% OTM calls.
In other words, at this point of the year incentive schemes drive people to be much more willing to pay and chase upside moves than they are to chase downside moves.
This largely exacerbated the equity market rally, whose extent is also visible in the SPX equity risk premium which just hit the 4.5% area - the lowest level since summer 2021 and in the 1-sigma expensive territory using a 15-year time horizon.

This leaves us with the 1 million dollar question: any actionable trade ideas ahead?
Portfolio Implications
Short-term, this bear market rally might extend a bit further.
I do not exlude the SPX to test 4150, but the air becomes pretty thin above that.
In markets, the best trade opportunities arise when either markets have largely mispriced the direction of travel or they are under or overestimating the speed and magnitude of the moves ahead.
Here, two trades stand out to me - both are medium-term trades that one could consider as backbone in their books for the next quarters.
One benefits from markets mispricing the direction of travel ahead: I expect a sharp nominal growth slowdown ahead, only likely to intensify in H2-23.
Yet, the bond market believes the Fed is going to keep rates in the 4%+ area while this significant and disinflationary recession hits.
The Fed forced to cut rates from 4.5% to 1.5% in a capitulation move similar to 2001 is only priced with a 10% probability in Jun-24 SOFR call spreads.
I disagree, and I bought these call spreads.

The second trade instead should benefit from markets being aligned on the direction of travel ahead, but largely underestimating its magnitude in my opinion.
I am talking about the real estate market.
This intuitive chart shows what happens when mortgage rates quickly move higher: give it 9 months, and real estate prices materially suffer.
My expectation is for a 15% move lower in house prices across many developed markets, and the recent monster rally in HomeBuilders and Real Estate ETFs offers a good opportunity to build some medium-term shorts.

Mid-2023 puts and put spreads on XHB (for Americans) and D5BK (for Europeans) start to look attractive here.
If you are a less tactical investor and you own real-estate related exposure, using this strong rally to reduce that might be a good idea.
Analysts are expecting a mildly weak 2023 for the real estate market.
Forward-leading indicators suggest they are still in La-La Land.
Thanks for reading, and now an important message below!
If you enjoyed this and the other 40+ pieces I’ve published this year, a reminder that from January 2023 this content (and much more) will require a paid subscription.
As a newsletter reader, if you are amongst the first 2,000 subscribers (~1200 spots left) you can get a 20% discount using the code ‘‘TMC’’ at checkout.
The offer is valid until November 30th and applicable to all the tiers below.
The Long-Term Investor: weekly macro & market insights, long-only model ETF portfolios and 25% permanent discount on all macro courses.
Full price in January: €399/year (39/month)
Using the ‘‘TMC’’ discount now: €319/year (26/month)
Subscription link hereThe All-Round Investor: all the above + timely macro & market reports around big events, tactical trade ideas, interactive macro tools (!), 50% permanent discount on all macro courses and a monthly Q&A Zoom call.
Full price in January: €1249/year (125/month)
Using the ‘‘TMC’’ discount now: €999/year (83/month)
Subscription link hereThe Pro Investor: the All-Round services + an exclusive monthly cross-asset piece + bespoke trade ideas for institutional investors + pro-dedicated interactive macro tools (!) + possibility to access me via Zoom, calls or email.
Full price in January: €5000/year (500/month)
Using the ‘‘TMC’’ discount now: €4000/year (333/month)
Subscription link here
Subscribing to any of the tiers above now will guarantee you lock-in early bird prices and your subscription will cover the entire 2023 calendar year.
For more information, here is the website.
DISCLAIMER
The content provided on The Macro Compass newsletter is for general information purposes only. No information, materials, services, and other content provided in this post constitute solicitation, recommendation, endorsement or any financial, investment, or other advice. Seek independent professional consultation in the form of legal, financial, and fiscal advice before making any investment decision. Always perform your own due diligence.


