Welcome back to The Macro Compass - and happy 2023!
Thank you for the amazing support last year.
I wish you and your families the best for this upcoming year.
Tell Me - What Are The Macro Models Saying?
The two main forces driving global macro and markets are the rate of change of (nominal) growth and the monetary policy stance.
Real-economy money creation and leading macro indicators inform us on the path ahead for economic growth.
Financial money creation and risk-free real yields are key to understand the Central Bank stance and its implications for markets.
The TMC Quadrant Asset Allocation model deploys a data-driven approach to assess where do we stand on both fronts, and it’s a useful tool to start our 2023 asset allocation journey.
In short: for both the US and Europe, we are sitting in Quadrant 4 – the trickiest quadrant for long-term macro investors.
Let’s quickly analyze both the x-axis (RoC of nominal growth) and the y-axis (MonPol stance).
The x-axis: nominal growth is set to rapidly decelerate in 2023.
A) The pace of real-economy money creation as measured by our flagship TMC Global Credit Impulse index is very low.
This index measures the rate of change in the quantity of money (in real terms, as % of GDP) held by the non-financial private sector in the 5 largest economies in the world.
In other words: whether the real spending power of households and corporates is accelerating or decelerating.
As per preliminary October 2022 data, the -3.5% reading is by far the worst in 10 years and in line with the GFC levels.
The TMC Global Credit Impulse index (black, LHS) leads earnings growth (blue, RHS) and inflation (orange, LHS) by 4-6 quarters.
As a result, nominal growth is set to dramatically slow in 2023.
B) Other leading macro indicators point to a rapid deterioration of the job market.
The Global Credit Impulse is only one of the many forward-looking macro indicators in TMC’s data-driven macro and portfolio strategy approach.
Amongst many others, the dramatic tightening of US Financial Conditions in 2022 sets the stage for a much weaker labor market in 2023.
After all, it’s how the economic cycle works.
Higher rates, wider credit spreads, lower equity multiples, higher US Dollar => tighter financial conditions => companies cut discretionary spending => weaker growth and earnings => deleveraging: companies cut capex and labor.
Rapid deterioration in US Financial Conditions lead weaker hiring trends by roughly 3 quarters.
By this measure, US Non-Farm Payrolls should quickly converge to zero in H1 2023.
Bottom line: both in Europe and in the US the real-economy printing press has stopped working, and leading macro indicators also point to a sharp deceleration in nominal growth.
We are sitting on the left side of the TMC Quadrant Asset Allocation model.
What about the other axis?
The y-axis: the monetary policy stance is very tight.
So far we talked about the real economy – credit, growth, inflation, the labor market.
The y-axis of the Quadrant model instead focuses on the monetary policy stance and the pace of financial money (i.e. bank reserves) creation.
A) Risk-free real yields are much higher than equilibrium – and that’s a problem for risk assets
Are interest rates high or low?
It’s all about relativity and equilibrium.
The US and European economies are both hyper-financialized, over-leveraged and grey-haired; perhaps to slightly different extents, but they are roughly in the same boat.
That implies that the equilibrium real rate (r*) at which these economies can run smooth and deliver potential growth without overheating or falling into recession are very low – high private and public debt levels, stagnant productivity, and an ageing population are to be blamed.
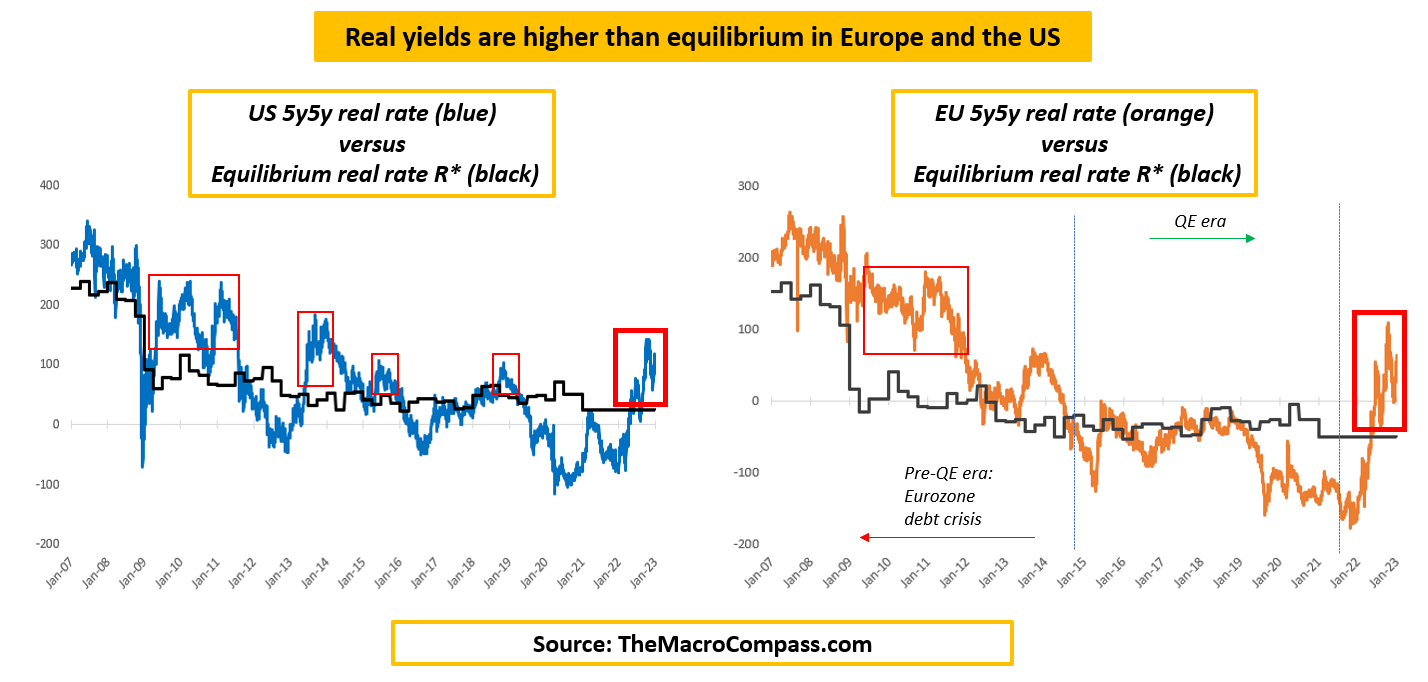
R* is estimated to be at roughly +25 bps in the US and -50 bps in Europe.
Today, market-implied medium term real yields are much higher than these equilibrium levels both in the US and in Europe.
This has important implications.
Real yields much higher than equilibrium impair the private sector ability to borrow cheaply, and hence dampen growth prospects while providing a high risk-free return for investors.
Not a surprise to see that every time such a setup was prevalent in the US (2009-2010; 2013 taper tantrum; 2018 hikes and QT; today) and in Europe (2011-2012: Eurozone debt crisis) risk assets had a hard time.
B) The financial money printing press seems broken too: from BRRR to RRRB.
The rate of change of financial money (i.e. bank reserves) is the other important component necessary to gauge the overall monetary policy stance.
When the amount of interbank money is rapidly increasing, banks tend to increase their appetite for riskier investments and provide more liquidity to financial markets.
But given the ongoing US QT, the newly announced European QT and the large amount of TLTRO repayments in Europe the 6-month rate of change of EU+US Bank Reserves is likely to hit its lowest level in 10 years during 2023.
Bottom line: real-economy money printing has come to a halt and nominal growth is set to quickly deteriorate in 2023, while the monetary policy stance remains tight and the global financial money printers are also broken.
So, how to invest in such an environment?
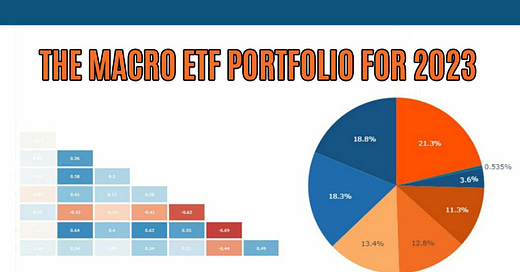
It’s now time to introduce the TMC Macro ETF Portfolio!
From January 2023, getting access to the premium The Macro Compass content will require a paid subscription.
Not only deep and unique macro insights but also ETF Portfolios, tactical trade ideas, interactive tools, courses and much more are available on the TMC platform.
Come join this vibrant community of macro investors, asset allocators and hedge funds - check out which subscription tier suits you the most using the link below.
For more information, here is the website.


Share this post