‘‘There are no gurus. There are only cycles.’’
Michael Gayed
The money printer is out of order in 2022.
Actually, we are even looking at BRRRR in reverse: the flow of credit reaching the private sector continues to materially slow down, as indicated by my G5 Credit Impulse metric.
On top of it, inflation is roaring its ugly head and Central Bankers are committed to turning monetary policy into explicitly restrictive territory as fast as possible.
When the flow of credit slows down and policymakers double down by pushing monetary policy into restrictive territory, you don’t play offense with your portfolio.
You play defense.
In this article, we will:
Update my main macro models, and discuss what are they telling us;
Look at the risk/reward profile of different asset classes going into Q2.
Without further ado, let’s jump right in!
A Tough Macro Cycle Ahead
Actually, before we jump right in.
If you are interested in any kind of partnership, sponsorship, or in bespoke consulting services feel free to reach out at TheMacroCompass@gmail.com.
Back to it: my updated macro models continue to indicate we are looking at a challenging macro cycle, and that playing defense with your portfolio is the way to go.
Let’s see where we stand for a second: this is how different macro asset classes performed throughout Q1 2022 (total returns, in USD).
Effectively, all asset classes delivered negative (inflation-adjusted) returns except for certain commodities and commodity exporting countries: a challenging environment for a diversified, long-only investor.
Alright, what next though? Let’s update my main macro models.
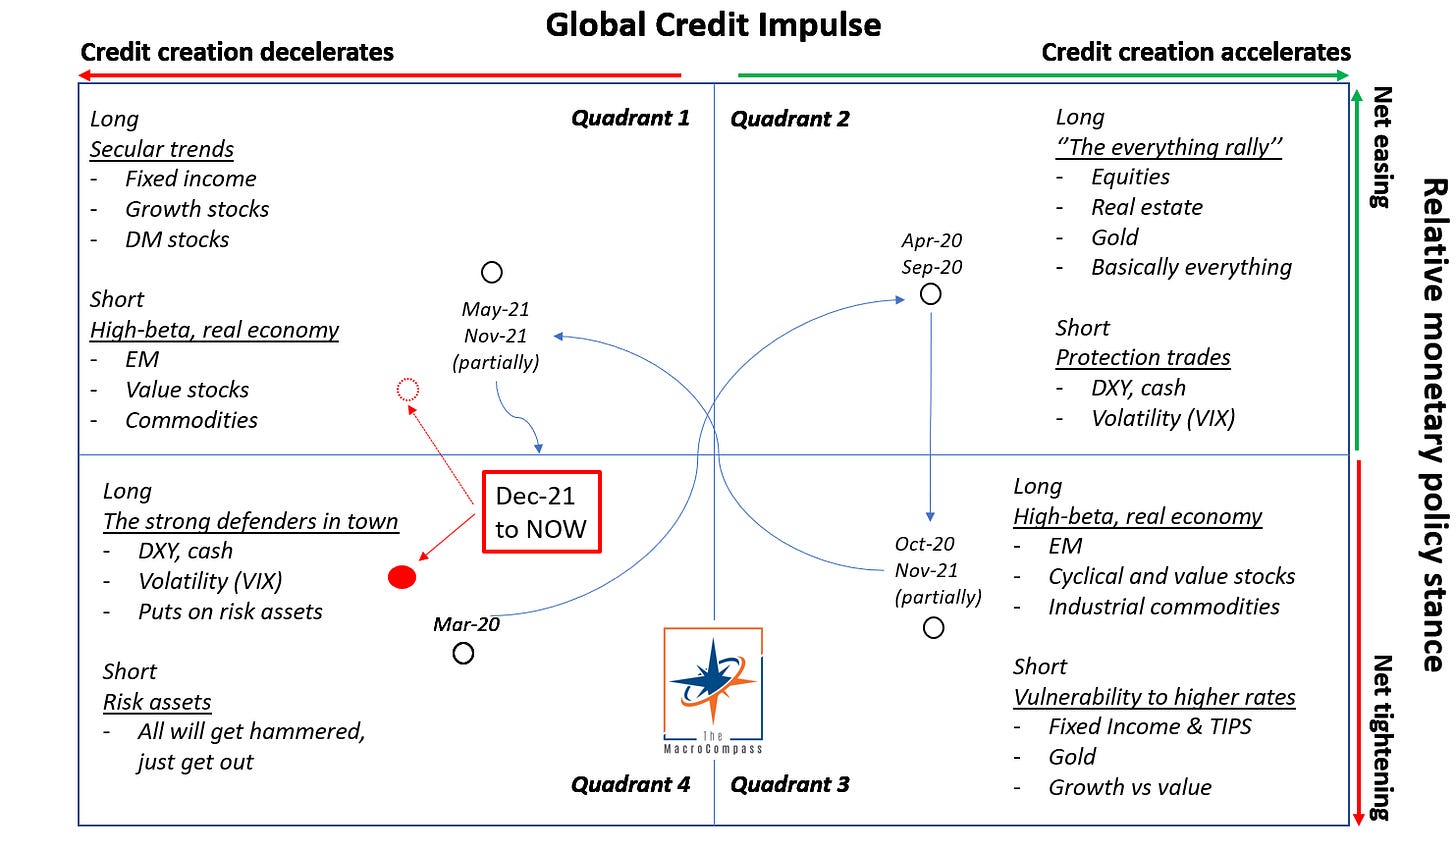
My investment thesis relies on several inputs, but my ‘‘polar stars’’ macro indicators are two: the G5 Credit Impulse as % of GDP and the implied monetary policy stance relative to a neutral setting (r*).
Charted together in a 4-Quadrant setup, they constitute The Macro Compass.
I will quickly cover the methodology here, but for further info see this piece.
The G5 Credit Impulse captures the pace of change of the flow of credit to the real economy. It tells you whether the private sector is receiving credit at an accelerating or decelerating pace.
Credit creation is the process of creating spendable money out of thin air that reaches the real economy and could be used to increase nominal economic activity. Governments create new spendable money for the private sector every time they incur in budget deficits (stimulus checks, tax cuts etc.) and commercial banks create new spendable money every time they extend a new loan to the private sector.
Central Banks don’t print spendable forms of money.
If the real economy was inundated with credit at any given point in time, give it a few months and you’ll see growth (and inflation) pick up.
Do the opposite, and it will cool off quickly.
Credit creation is the real BRRRR.

After the largest ever credit creation in the shortest amount of time in 2020-early 2021, we are now witnessing one of the sharpest deceleration in credit creation over the last few decades.
Analysts still expect earnings for the companies in the S&P500 index to grow at 9% this year, but my model suggests this is too optimistic.
When I overlay PMIs or GDP growth on this metric, the same conclusion stands: economic activity will sharply decelerate going forward, and consensus expectations are still too high across the board.
My second polar star macro metric is the implied monetary policy stance relative to a neutral setting (r*): both the absolute difference and the pace of change matter here.
The implied monetary policy stance is calculated using a blend of metrics, but for the sake of time we’ll focus on the market-implied terminal rate and only look at the US.
The US real terminal rate is the highest level Fed Funds can reach in the upcoming hiking cycle as priced in by fixed income markets, minus the inflation target (2%).
We will compare this market-implied metric with the “natural” rate of interest, or r-star (r*), which is the inflation-adjusted interest rate that is consistent with full use of economic resources and steady inflation. When the prevailing real interest rate in the economy is around r*, the economy runs at its potential rate without excessively under or overheating.

Currently, fixed income markets price the terminal Fed Funds just shy of 3% and hence the inflation-adjusted version at around 1%.
My estimate for the US neutral real rate r* is around 0%.
This means the relative monetary policy stance is expected to become restrictive, which is a rare phenomenon since 2015: last time this happened was in Q32018, with risk assets suffering a severe drawdown in Q42018 and the economy decelerating for several quarters.
On top of the expected restrictive monetary policy, the pace of change from a very accommodative setting in 2021 is expected to be very rapid: that matters too, as the private sector struggles to quickly adjust to increased (real) borrowing costs.
Here is a chart showing the pace of the Fed hiking cycles since 1994: the 2022-2023 cycle is priced to be amongst the quickest despite structural headwinds have arguably worsened over the last few decades (e.g. ageing demographics, unproductive debt).
Also, the private sector will be required to absorb an increasing amount of collateral: both the Fed (QT) and the ECB (TLTRO repayments) balance sheets will shrink in 2022-2023 while governments are expected to incur in net deficits.
Even if net government borrowing will materially slow down compared to the fiscal deficit frenzy seen in 2020-early 2021, the private sector will be required to onboard more collateral…with less reserves.
As a result, risk appetite and portfolio allocation preferences are likely to shift more defensive as a result.
Where does that leave us in The Macro Compass quadrant model?
We are now sitting in the defensive Quadrant 4, with occasional glimpses into the secular Quadrant 1 if and when certain conditions realize.
The Macro Compass embeds both my polar stars macro metrics and determines a big picture macro allocation according to the prevailing Quadrant.
As shown before, credit creation is sharply decelerating (hence we end in the left side of the Compass) and the relative monetary policy stance is expected to become restrictive and at a quick pace (hence we end in the bottom side of the Compass).
The prevailing Quadrant is hence the conservative Quadrant 4, which suggests a more defensive asset allocation.
If and when the economy slows down enough and the expected pace and extent of monetary tightening subsidizes, the Macro Compass might suggest re-entering risk positions in ‘‘secular assets’’ later this year.
Finally, a word of caution: The Macro Compass is not intended to be used as THE single macro model behind asset allocation and portfolio construction.
One of the main limitations of such an approach is that the Compass is mostly a demand-related macro indicator and it doesn’t take the supply side of the equation into account: for instance, even if the credit impulse is slowing and Central Banks are going quick into restrictive territory, the world is going to have a sticky demand for certain commodities.
What happens to the price of these commodities whose demand is sticky, and whose supply is strongly impaired?
For instance as China is completely shutting down entire cities?
Conclusion: Asset Allocation in Q2
The flow of credit reaching the private sector continues to materially slow down, as indicated by my G5 Credit Impulse metric.
On top of it, inflation is roaring its ugly head and Central Bankers are committed in turning monetary policy into explicitly restrictive territory as fast as possible.
When the flow of credit slows down and policymakers double down by pushing monetary policy quickly into restrictive territory, you don’t play offense.
You play defense.
As a medium/long term investor, I’d remain conservative and specifically:
Maintain a healthy cash allocation
If investing from a non-US jurisdiction, increase the USD allocation
If you need to be invested in risk assets, prefer low-beta investments and high-quality balance sheet companies
As a short/medium term investor, I’d try to tactically lean short here and there when the risk/reward profile seems attractive.
I have recently:
Closed my shorts in the Russell 2000 and High Yield Bonds
Opened a short in BTP/Bund spreads (long Bund future, short BTP future)
Maintained a US 2s10s flattener (long 10y US bond future, short 2y US bond future)
See my open and closed tactical positions below (you can track live changes by following me on Twitter).
Open question: would you like me to set up and regularly publish updates of a long-only ETF portfolio with a medium/long term horizon (1y+) and perhaps use as a benchmark a 60/40 portfolio to measure performance?
If you have suggestions on how to structure and report this new portfolio and the already existing tactical long/short portfolio, please let me know!
Thank you for making it all the way through! :)
If you enjoy my work, I would really appreciate if you could click on the like button at the end of the piece and share the article around.
It would mean the world to me!
For any inquiries, feel free to get in touch at TheMacroCompass@gmail.com.
If you want more macro insights, you can also follow me on Twitter and Linkedin.
See you soon here for another article of The Macro Compass, a community of more than 37.000+ worldwide investors and macro enthusiasts!


Share this post