


Hi all, and welcome back on The Macro Compass.
As you know, from January 1st getting access to this content (and much more!) will require a paid subscription.
Today we have a big news: monthly subscriptions are now open!
Check out which subscription tier suits you the most, and come join this exciting macro learning journey.
Let’s step up your macro game!
Yes, But Is It Priced In Already?
This short article will focus on answering a very relevant question: ok, recession, but is it already priced in?
Over the last few weeks we kept hearing a recession has become consensus amongst analysts and market pundits, and onboarding consensus macro views at the wrong price in one’s portfolio can be a very expensive exercises.
But we can do much more than rely on hearsay.
Using different techniques, we can test to what extent a recession is priced in both in bonds and equity markets and derive actionable conclusions.
That’s what this macro piece will be all about.

A Cross-Asset Analysis of Recession Probabilities
Let’s start with a very telling chart.
The number of respondents in the US SPF (Survey of Professional Forecasters) now foreseeing a recession in 2023 hit 44%.
That’s by far the highest percentage of respondents expecting negative GDP growth in over 50 years.
A recession is definitely becoming the consensus view amongst economists and market pundits.

Yet, economists don’t take risks in markets.
Investors do.
Hence, the most appropriate question is: what’s the probability of a recession being priced in by market participants across asset classes?
The answer to this question is very important when looking at asset allocation in 2023: once a view becomes market consensus, onboarding it in your portfolio at the wrong price can be very detrimental to returns in case that consensus view doesn’t materialize.
A bit like when the music stops in a very crowded dancing floor with a single tiny exit door - everybody wants out at the same time, and it can become tricky.
Let’s have a look at what the bond and equity markets are really pricing in.
The Bond Market
Over the last 30 years, the average recession led the Fed to cut rates by 300 bps in the first 12 months and by a cumulative 400 bps in the 24 months following the start of the recession.
Apart from the 2020 (green line below) C-19 flash recession the pattern of the Fed cutting cycle in 1990, 2001 and 2008 followed similar trajectories.
300 bps cuts in the first year.
Followed by another 100 bps cuts in the second year.

So the question is: what’s priced in today?
To answer, we first need to determine a potential start date for the 2023 recession.
My work suggests March-June 2023 is highly likely - to be conservative, let’s say a recession (net job losses, negative YoY earnings growth) starts in June 2023.
The chart below shows how the bond market is now pricing the most aggressive Fed cutting cycle immediately following a hiking cycle.
The closest example is 1990: Fed Funds (dotted blue) were raised to ~10% and the bond market smelled a recession and subsequent cutting cycle ahead, but they could only price in as much as 100 bps Fed cuts in the period going from the 6th and the 18th month ahead.
Today, the bond market has broken that record and it’s pricing almost 150 bps worth of Fed cuts between June 2023 and June 2024.
In other words: the bond market base case is definitely ‘‘a recession’’.

But.
Let me explain why ‘‘a recession’’ is different from ‘‘a proper recession’’.
As we said before the average Fed cutting cycle during a proper recession is 300 bps in the first year since the start of the recession - which we postulate around June 2023.
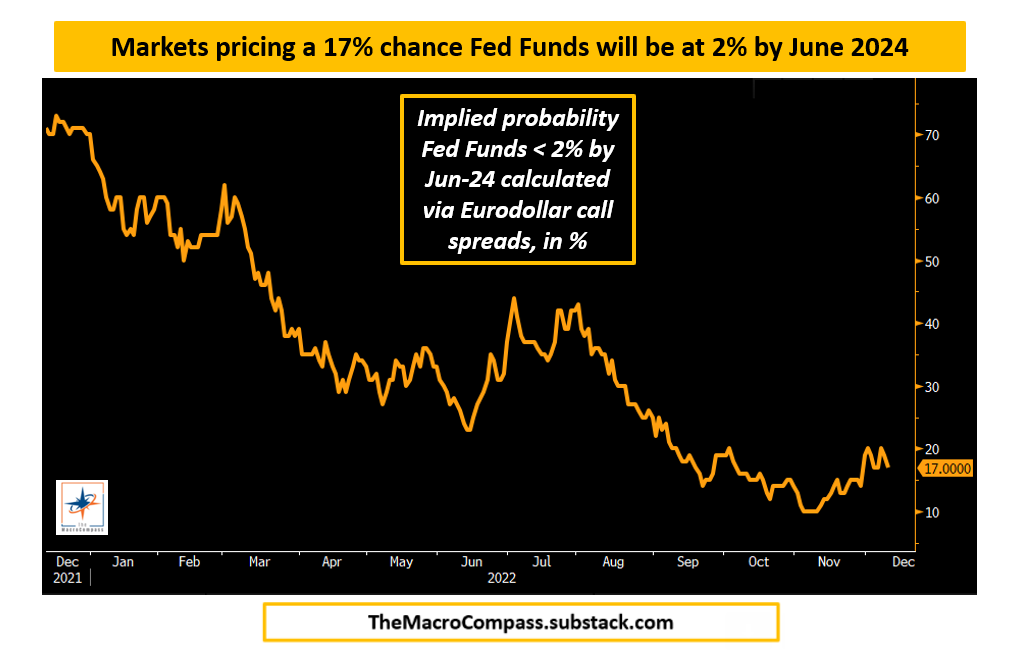
One thing is to price in ‘‘a recession’’ as base case, the other is to price in ‘‘a proper recession’’ that involves cutting Fed Funds from 5% to 2% by June 2024.
The option-implied probability derived from Eurodollar contracts that bond investors are assigning to ‘‘a proper recession’’ is still below 20%.
In short: yes, the bond market definitely expects a sharp slowdown in growth and given the shape of the money market curves a recession is definitely base case.
But a mild recession, not a proper one.
The market-implied probability of 300 bps cuts between June 2023 and June 2024 sits around 20%, while that of 400 bps cumulative cuts until June 2025 sits in the 25% area.
Overall, the bond market prices a recession as a 40-45% probability event.
But it prices a proper recession only as a 20-25% probability event.
The Stock Market
We also hear that ‘‘everybody is bearish’’, hence a recession must be fully discounted by the stock market.
Well, let’s have a more scientific look shall we?
Over the last 60+ years, an average recession involved earnings declining for more than 5 consecutive quarters and by almost 30% from peak to trough.
Here is your garden variety of EPS contractions - different lengths and magnitudes:

The equity market isn’t all about earnings though, but also about multiples.
Historically, earnings and multiples don’t bottom together - why?
Because when earnings have fallen for a couple of quarters already, it means the economy is really weak and so is the labor market.
This is generally a validating condition for the Fed to start easing monetary policy.
As they do so, risk-free rates decline and stock valuations tend to get an initial boost even if earnings keep falling.
When looking at a potential definite low for the S&P500 in this bear market, we therefore have to look at combined assumptions for EPS and multiples in 2023.
My work shows that:
Earnings could contract by 20% in 2023;
The average equity risk premium (ERP) in a recession should be above 5%, which boils down to ~16.5x forward P/E (~6% earnings yield) if we assume long-dated real rates in the 0.5-1.0% area next year = ERP around 5%
Here is what this boils down to for the S&P500 next year:
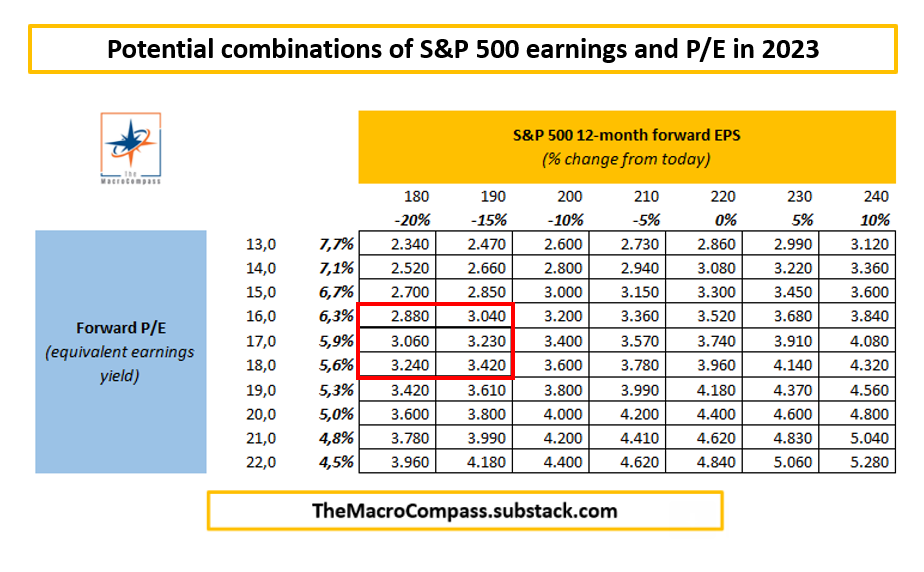
Assuming by December 2023 earnings have contracted by 10-15% and the Fed has clearly shifted their stance to dovish to counter the ongoing recession, the S&P500 could bottom in Q4 next year around 3,200-3,300 (EPS $190 * 17 P/E).
So: what’s the market-implied probability of the S&P 500 trading at or below 3,200 by the end of the next year?
Roughly 16%.
For reference, markets generally price a 20% drawdown (from ~4,000 to ~3,200) from spot levels in one year as a 10-12% probability event.

In short: yes, analysts are slowly revising down earnings growth.
And yes, investors are now pretty much aware we are in a bear market.
But stock market participants are discounting a < 20% probability of a S&P 500 price action that would fit a proper recession in 2023.
Conclusions & Portfolio Implications
Yes, ‘‘a recession’’ has arguably become conensus amongst economists.
And one could argue it’s almost become a base-case scenario for bond market investors, and that equity investors are well aware of the current bear market conditions.
So, is it all priced in?
Not really.
In an average recession, the Fed cuts 300-400 bps in 12-24 months and earnings decline for 5+ consecutive quarters and by around 30%.
That’s a ‘‘proper recession’’ that requires a proper Fed pivot.
Today, bond and equity markets are pricing roughly a 20% chance of a ‘‘proper recession’’ - and while macro investing is a probability game and we’ll never see markets pricing in a 100% probability of an exceptional event like a proper recession, 20% isn’t an incredibly high number.
For portfolios, that means that the ‘‘easy money’’ has been made: as markets quickly repriced ‘‘a recession’’ as their base case, bonds rallied aggressively while stocks didn’t follow suit as it should be.
But given ‘‘a proper recession’’ remains only mildly priced in, a macro portfolio construction that benefits from these relative mispricings can be still achieved.
Calling the time and magnitude of the recession is the main task ahead, and we will try to do that together on The Macro Compass in 2023.
And this was it for today, thanks for reading!
If you enjoyed the piece, please click on the like button and share it with friends :)
Finally, an important reminder.
From January 1st getting access to this content (and much more!) will require a paid subscription.
From today, not only annual but also monthly subscriptions are open!
Check out which subscription tier suits you the most, and come join this exciting macro learning journey.
Let’s step up your macro game!
Premium TMC services start on January 1st, 2023.
Annual subscriptions will grant you access to The Macro Compass premium content for the entire 2023 calendar year.
For more information, here is the website.
I hope to see you onboard!
DISCLAIMER
The content provided on The Macro Compass newsletter is for general information purposes only. No information, materials, services, and other content provided in this post constitute solicitation, recommendation, endorsement or any financial, investment, or other advice. Seek independent professional consultation in the form of legal, financial, and fiscal advice before making any investment decision. Always perform your own due diligence.


Share this post