


Hi all, and welcome back on The Macro Compass!
A warm thank you to the many subscribers who secured their spot to continue this macro learning journey together in 2023 by signing up for our premium products.
From January 1st, getting access to this content (and much more!) will require a paid subscription.
As a loyal newsletter reader, you can sign up now and get access to the TMC services for the entire 2023 paying only 8 months instead of 12.
This offer is limited in both time and spots available.
You have until November 30th (13 days left) to be amongst the only 2,000 subscribers who will exclusively benefit from this offer (~950 spots left, 50%+ taken in 5 days).
Check out which subscription tier suits you the most and take advantage of the exclusive offer here:
Intro
The bond market is often wrong.
Yes, you read that right.
Many believe fixed income investors have some esotheric power that allows them to always have an edge in anticipating how macro conditions will evolve.
The reality is that understanding the signals bond markets send across their many dimensions is not akin to looking into a macro crystal ball, but rather a very useful exercise because bond markets are the biggest and most liquid asset class in the world.
And if you want to get a better shot at piecing together the very complex and dynamic global macro puzzle, you’d better make sure your instruction manual is good.
The bond market is your instruction manual.
Hence, in this article we will:
Assess the current state of the US bond markets, with a particular focus on three interesting dimensions - curve slopes, volatility and implied Central Bank rates;
Discuss portfolio allocations and trade ideas.

When The Bond Market Talks, You Better Listen
Over the last 30 days, a lot has happened under the surface in bond markets.
And no, it’s not as simple as ‘‘bond markets now think the Fed will pivot’’.
Let’s instead look into three interesting dimensions that carry a lot of informational value: curve slopes, volatility and implied Central Bank rates.
To break them down, I will use the Rates section of my Volatility Adjusted Market Dashboard (VAMD) - an interactive macro tool which will be available to paid subscribers in 2023.

In the picture above, I focused on the rolling 30-days move across many segments of the US fixed income market.
One of the most important features of the VAMD is its color-coding mechanism.
The VAMD color-codes market moves based on their magnitude: the darker the color, the bigger the move in standard deviation terms and hence the more interesting market action to focus on.
Let’s cover the 3 areas circled in black.
#1: Market-Implied Path for Fed Funds
The bond market is getting around this idea that the Fed won't massively pivot.
But instead, it will go for a long, very long pause.
As you can see in the VAMD (Forward OIS section), market-implied Fed Funds have rallied significantly over the last 30 days.
Yet, putting things in context: bond markets are now expecting Fed Funds to peak at 4.9% in 6 months and then to remain above 4% until Q1 2024!

Rather than a sharp pivot, this is fixed income investors assigning a higher and higher probability to a long pause with Fed Funds rate well in restrictive territory for the entire 2023.
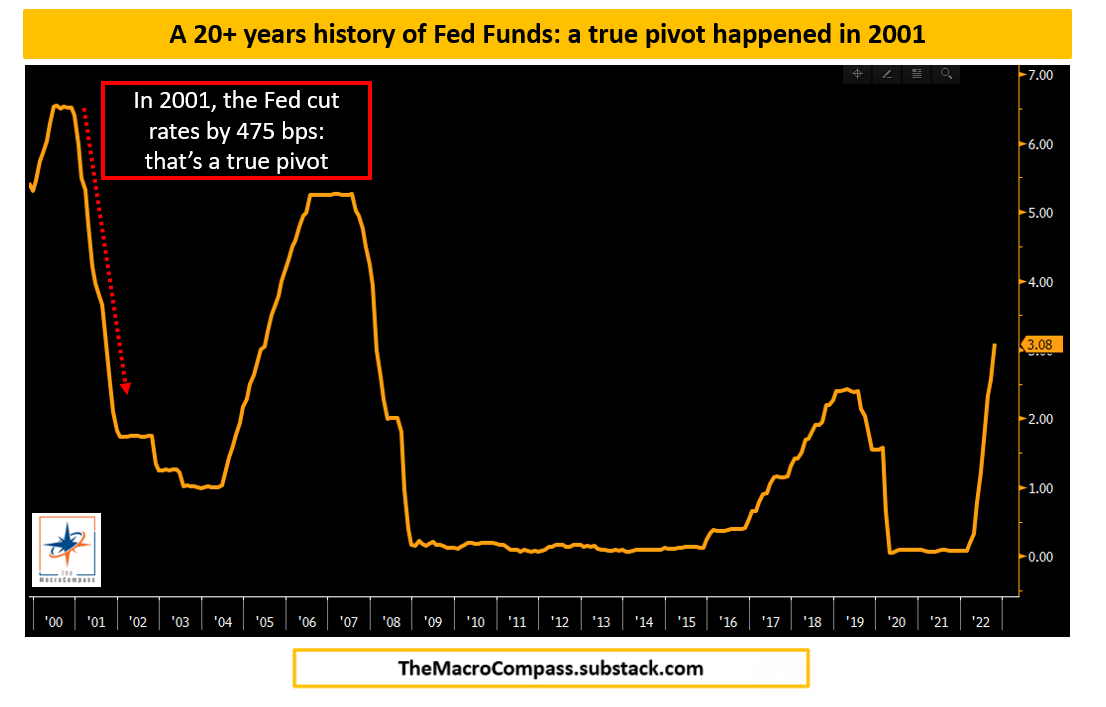
For comparison, if you are looking for a true pivot have a look at 2001 (a historical parallel The Macro Compass models are strongly pointing to for what’s ahead in 2023).
Back then, the Fed cut rates by 475 bps (!) in 12 months as earnings and the labor market were materially weakening, and inflation was slowing down too.
In other words: long pause now priced as the base case, while a true pivot only remains a tail risk.
This stance is also reflected in implied volatilities - let’s have a look.
#2: Implied Volatility
The option market in fixed income is very large, and it involves a variety of actors: hedge funds, banks, insurances, pension funds and more.
Hence, it’s a very important dimension to consider.
The Volatility section of the VAMD screenshot shows the implied annualized volatility priced for the next 3 and 12 months in various segments of the curve: a 1y2y swaption ATM vol would reflect the implied volatility priced in for the next year for 2-year rates, and so on.
Notice how the 12-month implied volatilities for 2, 5 and 10y rates have recently staged a very significant downward move: why, and what does it imply?
If the main theme is a long Fed pause, Powell’s volatility around monetary policy decisions in 2023 will likely be much lower than in 2022.
And when there is less uncertainty around such an important market driver, investors can be marginally more aggressive in taking risks as the bond market behaves better and it reduces some of the explosive volatility it brought to their portfolios in 2023.
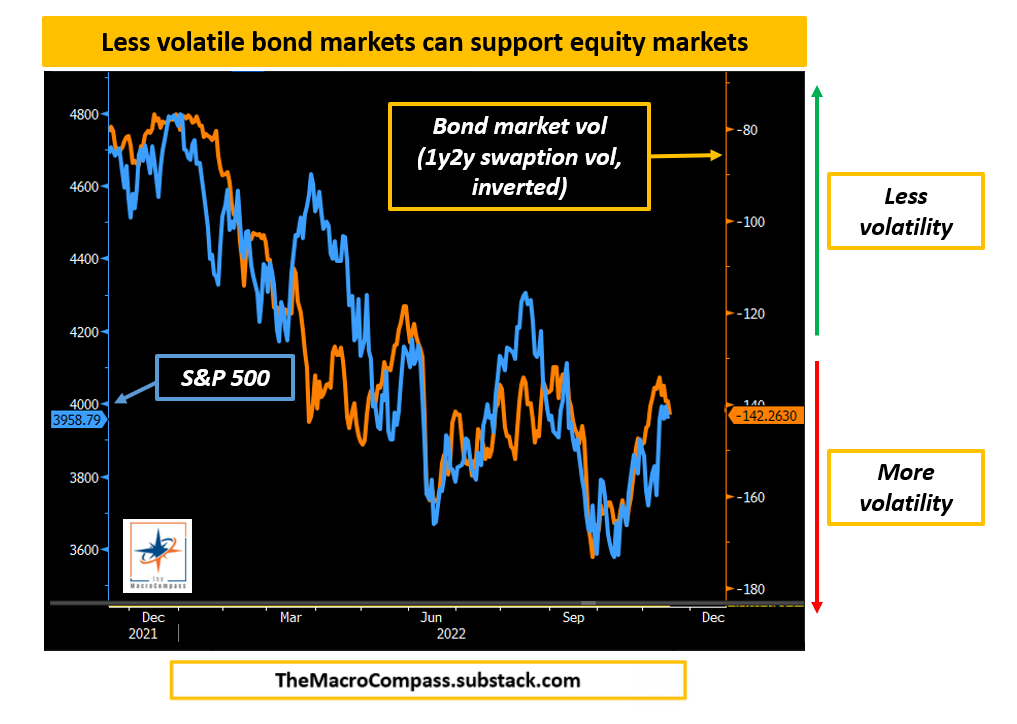
The chart above shows how equity investors (S&P 500, blue) got rattled by a higher and higher bond market implied volatility (orange, inverted) throughout 2022.
Recently, the ‘‘long Fed pause’’ narrative and its subsequent lower bond market volatility has helped equities rally on the margin.
Generally speaking: lower bond market vol = stronger risk appetite.
Finally, if the Fed is seen to pause soon and pause for a while the yield curve can behave funnily.
And it did - let’s have a look.
#3: The Yield Curve
The yield curve moves are truly fascinating here - as you can see in the ‘‘OIS Curves’’ section of the VAMD screenshot we saw the following:
- An aggressive flattening in the 2s5s and 2s10s curve slopes;
- Aggressively steepening in the 5s10s, 5s30s and 10s30s curve slopes.

That's really interesting, and again it revolves around the strong consensus fixed income investors are forming around a ''long Fed pause'' narrative: why?
If the economy is slowing down but Powell keeps insisting on setting monetary policy looking in the rearview mirror and waiting for core inflation to consistently drop towards 2%, he is going to pin 2y yields at high levels and nobody can fight that.
After all, the Fed has a strong influence on the very front-end of the curve.
But 5-year and 10-year bonds start to reflect growth and inflation expectations further down the road, and a very restrictive Fed compounding economic weakness is going to leave some long-lasting scars on the economy.
As that gets reflected in lower 5y and 10y yields, 2s5s and 2s10s aggressively flatten.

So, how come the curve is steepening in 5s30s then?
The thing is bond markets are NOT pricing in a true recession, but just a marked economic slowdown coupled with a Fed mostly on hold in 2023 and perhaps easing a bit into 2024 to gently accompany a slow recovery.
Under the assumption the economy won't fall of a cliff, a less aggressive Fed from 2024 onwards might coincide with a slow return to slightly higher nominal growth in the long-term, and hence curves can steepen a bit in the long-end.
Looking at the big picture though, 2s10s are more inverted than in '00 and could be heading to Volcker-era inversion levels if the Fed doesn't really back off.
Now, what does it all mean for portfolios?
Portfolio Implications
Across their many dimensions, bond markets are discounting a high probability of a long Fed pause in 2023, accompanied by an economic slowdown (but not a real recession) that will require some mild accommodation in 2024.
On the other hand, equity markets are priced under the assumption that the slowdown will be even milder (SPX 2023 EPS growth still at +5%) and lower bond volatility coupled with seasonal institutional behavior has spurred a rally to ~4,000.
The Macro Compass models indicate this combination is NOT a high probability outcome in 2023.
After an unprecedented tightening of monetary and fiscal impulses in 2022, and a dramatic slowdown in the housing market the TMC models are pointing to a macro base case encompassing:
A disinflationary recession in the US (even more acute in H2-23);
S&P 500 2023 EPS growth to be in the -15% (!) area;
US unemployment to rise towards 6% in 15-18 months;
Core inflation to sit ~4% until mid-23, and to rapidly drop in H2-23.
In a Long-Only ETF Portfolio, this base case macro environment validates a defensive allocation tilted towards cash, bonds and defensive equity sectors (e.g. utilities, healthcare) and very light on cyclical and valuation-expensive sectors.
The ETF Portfolio will be made available to subscribers in January, and cover investable ETFs from all major jurisdictions (including Europe, UK etc).
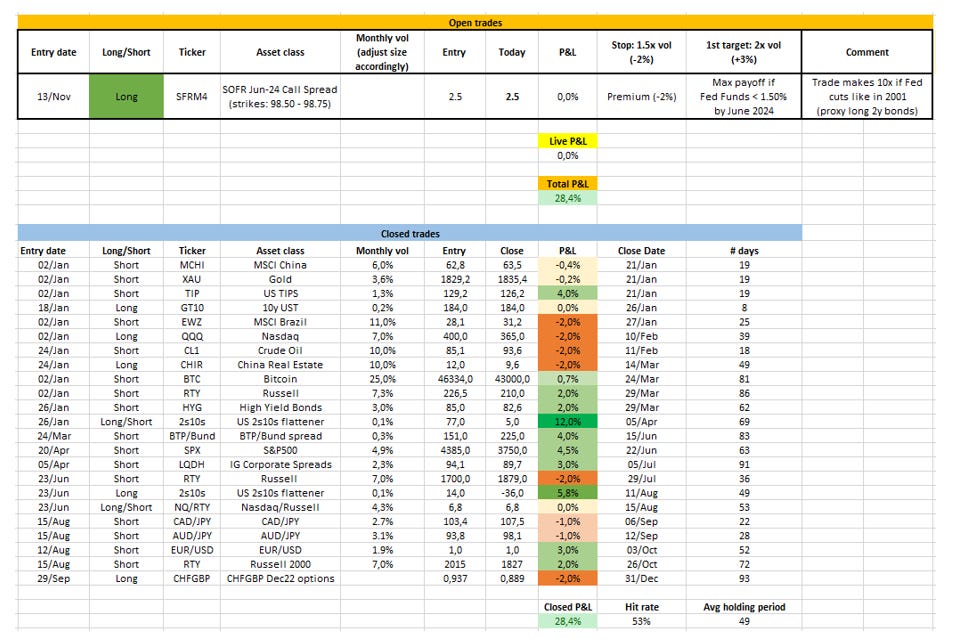
When it comes to Tactical Trades, I am running a tail trade which delivers a positive payoff if the Fed is indeed forced to cut in a similar fashion to 2001 - it’s effectively a proxy-long 2-3y bond trade (proxies: SHY, 2y Treasury futures).
I am also eyeing a short on Real Estate (US proxies: XHB short, SRS long; EU proxies: D5BK short, TRET short), especially if this bear market rally would extend.
Below my open and closed trades, and my YTD track record.

And this was it for today, thanks for reading!
If you enjoyed the piece, please click on the like button and share it with friends :)
Finally, a quick but important reminder.
From January 2023, The Macro Compass will graduate from a newsletter to a comprehensive macro platform.
Our quality content will become much more frequent and be enhanced by macro courses, interactive tools, model ETF portfolios/tactical trade ideas and much more.
Starting January 2023, getting access to this premium content will require a paid subscription.
As a newsletter reader, if you are amongst the first 2,000 subscribers (~950 spots left) you can get a 20% discount using the code ‘‘TMC’’ at checkout.
That effectively means you pay only 8 months instead of 12!
The offer is valid until Nov 30 (only 13 days left) and applicable to all the tiers below.
The Long-Term Investor
Full price in January: €399/year (39/month)
Using the ‘‘TMC’’ discount code now: €319/year (26/month = pay 8 months, get 12)
Subscription link here
Weekly macro & market insights;
Long-only model ETF portfolios;
25% permanent discount on all macro courses.
The All-Round Investor
Full price in January: €1249/year (125/month)
Using the ‘‘TMC’’ discount code now: €999/year (83/month = pay 8 months, get 12)
Subscription link here
The Long-Term Investor services;
Timely macro & market reports around big events or volatile market conditions;
Tactical trade ideas;
Interactive macro tools (!);
50% permanent discount on all macro courses
A monthly group Q&A Zoom call.
The Pro Investor
Full price in January: €5000/year (500/month)
Using the ‘‘TMC’’ discount code now: €4000/year (333/month = pay 8 months, get 12)
Subscription link here
The All-Round Investor services;
An exclusive monthly deep-dive cross-asset piece;
Bespoke trade ideas for institutional investors;
Pro-level interactive macro tools (!);
Possibility to access me via Zoom, calls or email.
Subscribing to any of the tiers above now will guarantee you lock-in early bird prices and your subscription will cover the entire 2023 calendar year.
For more information, here is the website.
I hope to see you onboard!
DISCLAIMER
The content provided on The Macro Compass newsletter is for general information purposes only. No information, materials, services, and other content provided in this post constitute solicitation, recommendation, endorsement or any financial, investment, or other advice. Seek independent professional consultation in the form of legal, financial, and fiscal advice before making any investment decision. Always perform your own due diligence.


Share this post