


‘‘Before you invest, you must ensure that you have realistically assessed your probability of being right and how you will react to the consequences of being wrong’’.
Benjamin Graham - The Intelligent Investor
Investing is all about probabilities: all you need to do is assess the chances markets are assigning to different scenarios today and anticipate how this probability distribution will move over time.
In other words, you don’t need to be necessarily right on what happens next but just be able to grasp how market consensus will move from here.
Ignoring this simple principle has been a very expensive exercise for European fixed income investors over the last few weeks: the-ECB-will-never-really-hike mantra is melting under the eyes of bond investors married to a dovish narrative which has been successful for a decade but offers a very bad risk-reward today.
In this article, we will:
Discuss the biggest volatility-adjusted moves seen in global macro last week;
Explain why Europe is in a tight spot, which will lead us to…
…assess where the best tactical risk-reward investment opportunities might lie.

What? European Rates Are Actually Moving?!
Actually, before we jump right in.
There are so many good macro newsletters out there, and there is always so much going on in global markets - and honestly it’s hard to keep track of everything!
I personally find Harkster’s free newsletter extremely useful: every morning, you get your global macro and news highlights in a concise and to-the-point format.
It only takes 5 minutes to parse through and you also get an overview of the top 5 trending macro articles on their fantastic free newsletter aggregator platform.
Such a useful (and free) service: I definitely recommend to check it out (link here)!
Now, back to it.
Here is what the Volatility Adjusted Market Dashboard (VAMD) is showing for the last 7 days: as the legend points out, the darker the color tonality the more significant was the move in standard deviation terms.

Most of the action happened in rates, and specifically in the Eurozone front-end of the yield curve with some 3+ weekly standard deviation moves: wow!
So, what’s going on there?
Inflation keeps surprising on the upside, and price pressures are broadening: core CPI is running at almost 4% annualized and the stickier components of the inflation basket (ex-energy services) are getting hit too.
If it sounds familiar, it’s because a similar dynamic started unfolding in the US a few quarters ago already.
Not only that, but the momentum of the latest European inflation pickup has been impressive - if you annualize the 3-months change in CPI, you realize such a concentrated inflationary impulse has been last experienced in…the ‘80s?!

So obviously the European bond market had to react, and it did.
But let’s look together under the hood and appreciate a few macro nuances.
In particular:
A) What’s the market pricing now, and is it enough - what’s the neutral rate in Europe anyway?
B) How does this square with the ECB ‘‘hidden dual mandate’’, i.e. prevent the hugely important geopolitical project (aka Eurozone and the EUR) to disintegrate?
After the sharp sell-off in front-end European yields, the EUR Overnight Index Swap curve (see here why I prefer OIS to look at yield curves) is pricing the following:

110 bps worth of hikes being priced by December 2022: 4x25 bps with a 50% chance the ECB will hike by 50 bps in one of the 4 meetings between July and December.
After that, roughly another 100 bps hiking cycle in 2023 and after that…
Ladies and gentlemen, your next and final stop: the market-implied ECB terminal rate, which currently sits at around 1.70%.
But as I explained in this article, when a Central Banker is faced with a prolonged period of high, broadening and stickier inflation the reaction function can quickly become very aggressive as the need to preserve credibility dwarfs anything else.
And an aggressively tighter monetary policy stance is not reflected in an absolute level of interest rates, but in how much higher these rates are versus the neutral rate.
So, the question is: what’s the neutral rate in Europe?
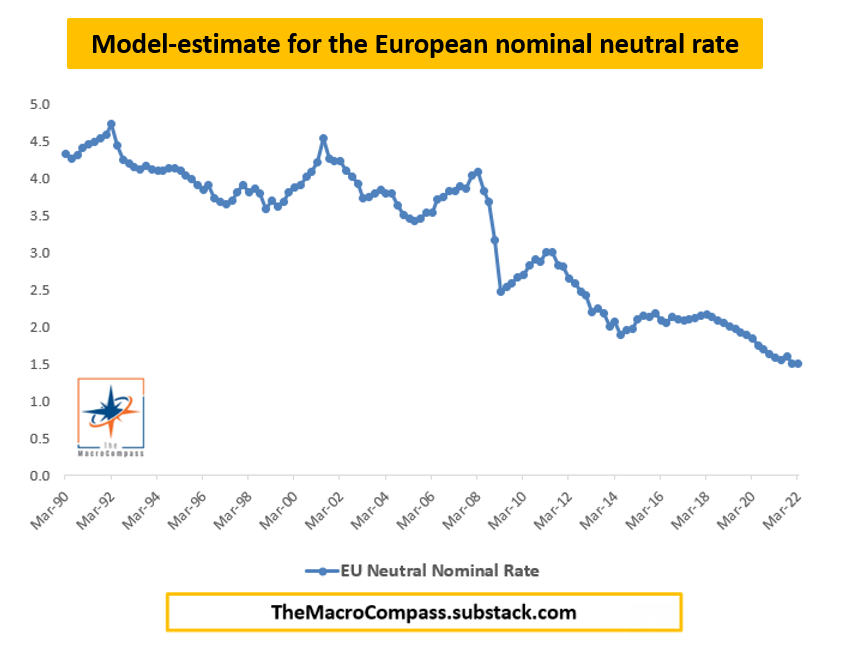
My model-estimate for the European nominal neutral rate is pictured in blue: it has been unsurprisingly trending down over the last 30 years due to poor demographics, higher and higher loads of unproductive debt, capital misallocations and so on.
It now stands at around 1.40% (roughly -0.60% in real terms).
As the current market pricing for the ECB terminal rate stands at 1.70%, one might argue the ECB reaction function is correctly priced: a swift tightening of monetary policy to levels above neutral rates (30 bps above) to fight inflation.
Well, not really.
I went back and looked at the latest episode of prolonged price pressures which pushed European inflation meaningfully above 2% for a while: it happened in the early ‘90s - and as the EUR didn’t exist back then, I used France as the barometer for the Eurozone in my analysis.
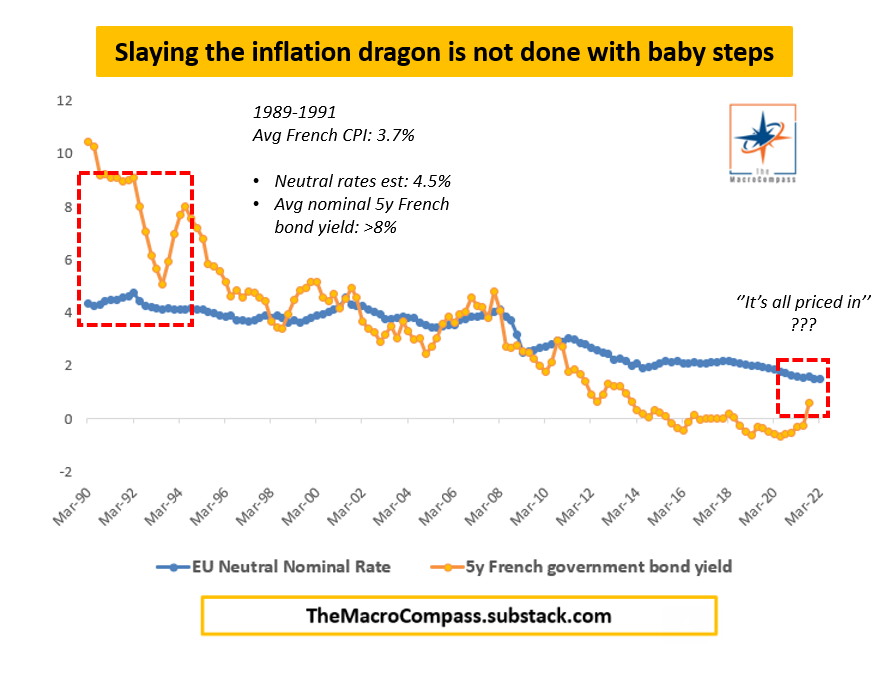
As you can see in the red box, in order to tame the sticky 4%-ish French CPI and avoid the un-anchoring of inflation expectations, the Banque De France pushed 5y French government bond yields way above (not 30 bps, but 350+!) any reasonable estimate for the prevailing levels of neutral nominal rates.
And they succeeded in their mission: 18 months later, inflation was back around 2%.
In other words, Central Banks can rarely slay the inflation dragon with baby steps: hence, the path of least resistance is for European bond markets to keep pushing the ECB towards a more aggressive hiking cycle.
But that also means higher interest rates while:
Europe gets squeezed as a net commodity importer amidst big supply chain bottlenecks;
Real income growth is deeply in negative territory as inflation outstrips nominal wage increases;
By construction, the ECB has to set the same monetary policy for Germany and Italy which implies an overly punitive stance for the latter.
Which leads me to the true European conundrum: how can this more hawkish monetary policy stance be conciliated with the ECB ‘‘hidden dual mandate’’, i.e. to prevent the hugely important EUR geopolitical project to disintegrate under the pressure of widening cross-country spreads?
In my opinion, it can’t: right now, it’s all about getting a grip on inflation and also avoiding EUR/USD from flirting with parity.
And the BTP/Bund spread represents the proverbial sacrificial lamb on the altar…

Macro Investment Ideas
So, what about our macro portfolios?
For the long-term oriented readers: while I work through systematizing all the macro models into a long-only ETF portfolio, my broad prescriptions remain the same I have been highlighting since December 2021.
Keep a healthy cash allocation and stay away from (especially speculative and valuation-intensive) risk assets: this is the time to preserve our capital and play defense, not offense.
For the nimbler investors, here is my current long/short tactical book.
I added an explanatory note on the strategy of this book at the end of the article, in case you are interested.

The book reflects my bearish stance on risk assets, and especially on credit (BTP/Bund and US Investment Grade Corporate Spreads) and equities (SPX).
It is often updated on Twitter but from now onwards you will receive more regular updates on The Macro Compass newsletter too.
I see 3 main scenarios ahead of us with the respective subjective probabilities assigned:
A) Inflation slows down very aggressively, and Central Banks can afford to tighten much less: the bond market rallies, and even though the economy is weak we witness a big compression in risk premia - 10% chance, and I get stopped out everywhere.
B) Inflation ‘‘peaks’’ and slows down but less than implied by inflation forwards and Central Banks projections: reaction functions must be priced more aggressively and/or the tightening cycle has to last longer while the economy weakens - 65% chance, and my positions are ok.
C) Inflation momentum doesn’t really decelerate: aggressive, Volcker-like Central Banks reaction function leading to a prolonged bear market - 25% chance, and my positions do very good.
Looking at inflation forward pricing, the market-implied for Central Banks policy rates and levels of risk premia across asset classes I’d argue the market is pricing a 35-55-10 distribution at this stage and in particular it underestimates the potential for a much more hawkish Central Banks’ stance to tame inflation - I disagree, and that’s why I keep being tactically short risk assets.
It’s all about inflation and the Central Banks reaction function here.
But always remember: you don’t need to be necessarily right about the final outcome; you just need to anticipate how the market probability distribution will move from here.
Thanks for reading all the way through, you are my hero! :)
Last but not least: if you are interested in any kind of partnership, sponsorship, or in bespoke consulting services feel free to reach out at TheMacroCompass@gmail.com.
If you enjoy my work, I would really appreciate if you could click on the like button at the end of the piece and share the article around.
It would mean the world to me!
For any inquiries, feel free to get in touch at TheMacroCompass@gmail.com.
For more macro insights, you can also follow me on LinkedIn, Twitter and Instagram.
Feel free also to check out my new podcast The Macro Trading Floor - it’s available on all podcast apps and on the Blockworks Macro YouTube channel.
See you soon here for another article of The Macro Compass, a community of more than 50.000 worldwide investors and macro enthusiasts!
The investment strategy behind The Macro Compass L/S Tactical Book:
The book targets a 20% annualized return with a 10% maximum peak-to-valley drawdown, and the max loss per trade is defined at 2% of AuM (aggressive, I know: but this strategy represents only a portion of my overall approach to investing my savings). The horizon is 1-3 months.
Trades are sized according to their underlying volatility: a 1.5+ standard deviation move against me (based on 5-yrs rolling monthly history) stops me out, while a trailing profit target strategy is applied if the trade is going my way by moving the next profit target higher and tightening the stop (now making positive P&L) on the way up.
By letting the profits run, I managed to generate a 12% return (6 monthly sigma!) on a single trade this year - the US 2s10s flattener.
A time-based stop is also applied, especially on negative carry trades: if the trade isn’t moving in my direction after 3 months, I take it off and re-allocate risk budget.
Trades are structured via futures when available, otherwise options or ETFs.
My win rate is generally around 55% (this year 64%, I am lucky) but as my stops are well defined, the idea is to have my positive P&L trades exceed my negative P&L trades at the end of the year by a decent margin.
DISCLAIMER
The information provided on The Macro Compass newsletter is for general information purposes only. No information, materials, services, and other content provided in this post constitute solicitation, recommendation, endorsement or any financial, investment, or other advice. Seek independent professional consultation in the form of legal, financial, and fiscal advice before making any investment decision. Always perform your own due diligence.


Share this post