I don’t see recession chances as particularly elevated now, as consumers have a very substantial cushion of savings. 100 bps hikes are not off the table.
Jerome Powell - Senate Banking Committee hearing, June 22nd 2022
In yesterday’s Senate Banking Committee hearing, Powell brought his hawkish stance to new highs: a strong economy underpinned by healthy levels of consumers’ savings, 100 bps hikes not off the table, and to top it off a good likelihood the Fed will actively sell (!) mortgage-backed securities from their balance sheet.
Ok, so just more of the same?
Well, there is a big news: for the first time in 8 months, the bond market isn’t compounding Powell’s hawkish rhetoric.
Actually, it isn’t even aligning with his stance in the first place.
Instead, fixed income investors have become loud enough we can almost hear them ask one big question: a recession is becoming increasingly likely, so what are you going to do about it J-Pow?
In this article, we will:
Discuss the cross-asset evidence that demand destruction might be intensifying to more worrisome levels;
Look at the whether the conditions to buy bonds are finally fulfilled;
Update our portfolios accordingly.
Wen Bonds, Alf?
Actually, before we jump right in.
There are so many good macro newsletters out there, and there is always so much going on in global markets - and honestly it’s hard to keep track of everything!
I personally find Harkster’s free newsletter extremely useful: every morning, you get your global macro and news highlights in a concise and to-the-point format.
It only takes 5 minutes to parse through and you also get an overview of the top 5 trending macro articles on their fantastic free newsletter aggregator platform.
Such a useful (and free) service: I definitely recommend to check it out (link here)!
Now, back to it: is it time to buy bonds?
For decades, bonds have been a beautiful asset to own in a diversified portfolio: a positive carry, return generating asset class with the ability to dampen equity market drawdowns. Wow.
But does this hold true in every macro regime?
The chart above shows a 20-year history for the US 5y inflation expectations (swaps, orange) against the 3-months rolling correlation between bonds and stocks returns (TLT vs SPX 90d rolling correlation, bottom part of the chart).
The interpretation is very clear: keep inflation expectations comfortably around/below the 2% area instead and bonds are going to be negatively correlated to stocks on a consistent basis.
Instead, once you cross the 2.5% threshold in 5y inflation expectations the negative correlation property quickly disappears.
But why?
That’s because once inflation expectations meaningfully surpass the Central Bank’s stated objective (2%), when equity markets experience a drawdown policymakers are faced with a hard choice: either accommodate conditions to stop the market bleeding or stay the course and preserve credibility about their inflation mandate.
For the time being, Powell has chosen to stay the (tightening) course.
Can you guess what that meant for markets?
As the equity market experienced a severe drawdown and bonds couldn’t serve as a portfolio hedge in this environment, we just witnessed the largest ever ‘‘financial wealth’’ destruction in history.
Ouch!
Even without factoring in crypto and other asset classes, US bonds and equities markets combined have experienced a drawdown from previous peak of about $15.5 trillion (or 60% of GDP).
Just. Huge.
So: when will bonds regain their magic property of return-generating, drawdown dampening asset for your portfolio?
In other words: when can we buy bonds again?
Let’s have a look at my 3-points checklist and see where we stand.
1. Is the momentum of growth slowing?
Yes.
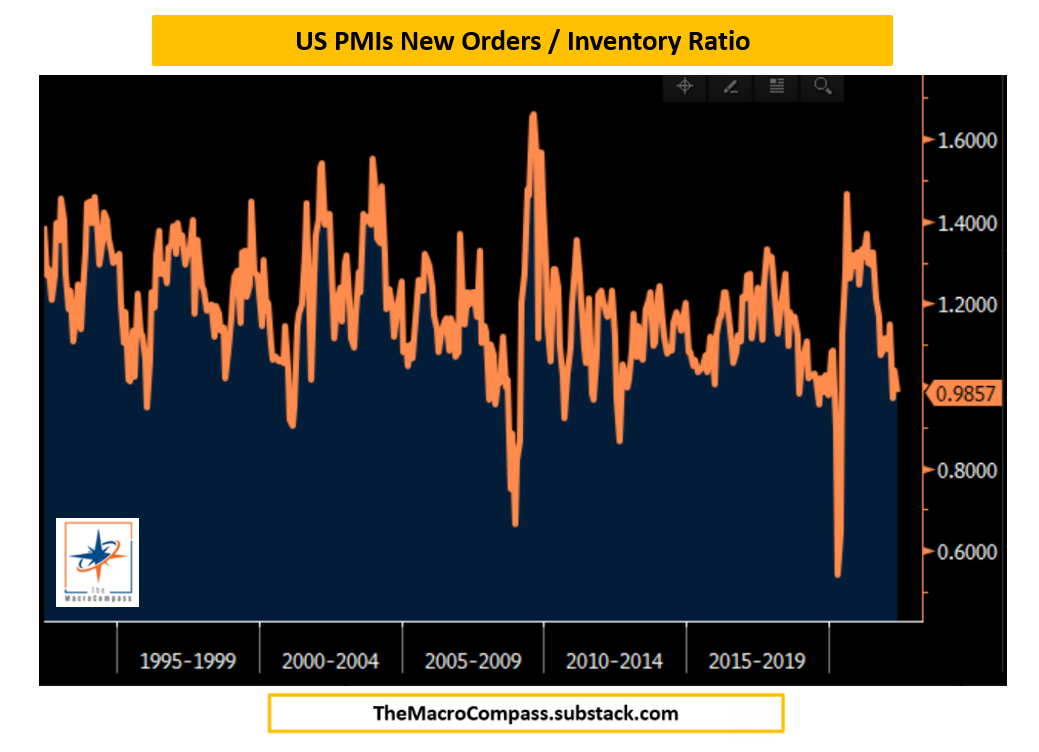
The PMI New Orders / Inventory ratio is one of the many forward looking indicators I incorporate in my macro investment process, and it’s been on a never-ending downward path for 14 months now. Check.
And not only the momentum, but also the outright level is quite telling: prints < 1 in this ratio have last been seen in 2019 (0% earnings growth that year), 2012, 2009, 2001…you get it.
2. Is the momentum of inflation slowing?
Meh, not really…but.
In a previous article (here), we have explained how inflationary pressures have been broadening from food and commodity-related prices to the stickier categories like core services.
Nevertheless, commodity prices across the board (in the chart: blue/orange/green) still contribute for a good portion towards the high US CPI prints.
We also discussed how for bonds to regain their magic portfolio properties, we need 5y inflation expectations to drop below 2.5%.
And do you know what correlates well with inflation expectations?
Yep, you guessed it: commodities.
And while we will have to wait to get any evidence of a slowdown in the inflation momentum, my Volatility-Adjusted Market Dashboard (VAMD) shows some interesting patterns this week.
Industrial/cyclical commodities: down.
Commodity exporters (Brazil) underperforming importers (India, Japan).
Fixed income in Europe (whose hiking cycle will be inevitably influenced by the evolution of commodity prices): big rally.
Have Central Banks engineered enough demand destruction already to sustainably hit even the supply-constrained commodity complex, and hence lower inflation and inflation expectations?
Can’t tick the box with full conviction yet, but time is an important factor here.
Which brings us to…
3. Are Central Banks (directly or indirectly) giving us the green light to buy bonds?
Indirectly: basically, yes.
As my good friend and legendary investor Jim Leitner would say: always carefully listen to the Game Masters (= Central Bankers).
Have they sent us a direct or indirect green light signal yet?
A. Direct green light: the first phase of monetary policy accommodation. When they explicitly pivot dovish vis-à-vis market consensus or they engage in QE, they are giving us a direct green light to lift bonds. Easy to follow, right?
But they definitely haven’t sent us this signal. Actually, quite the opposite.
B. Indirect green light: they have tightened policy hard enough for long enough to basically guarantee a sharp economic slowdown. In that case, as they are enhancing the probability of nominal growth reverting to weak structural trends they are also increasing the appeal of long-term bonds.
An indirect green light signal to buy bonds.
But how do we quantify that signal?
Focus on the red arrows and red box on the chart above.
In the late ‘90s, the Fed forced real yields (blue) to trade above my estimate for equilibrium real rates r* (orange) for a prolonged period of time (red box).
In 2007 and 2013, the Fed pivoted hawkish fast and furious (red arrows).
That meant real yields quickly moved from below to above equilibrium levels.
In both cases, the indirect green light signal was evidently sent and a sharp and sustained bond rally ensued.
But why?
Because when monetary policy becomes restrictive for long enough (red box) or sharply moves from very accommodative to tight (red arrows), our credit-addicted private sector suffers big times.
Once cheap credit dries up, leveraged business models take a large hit and the subsequent demand destruction cripples economic growth for a while to come.
In other words, the distribution of outcomes for future nominal growth becomes more predictable: once enough short-term damage is done, long-term growth is almost guaranteed to disappoint.
And in turn that means long-term bonds are more attractive.
You see that red dot? That’s where we are.
The indirect green light has been turned on.
And as we are ticking almost all boxes, it’s time to look at what does it mean for our portfolios and tactical trades.
Portfolio Update
Summing up: in the Senate Banking Committee hearing, Powell told us he isn’t gonna dial back his hawkish stance despite clear signs of demand destruction emerging in both forward-looking indicators and now also in several macro asset classes.
As time goes by, this is going to increase the probability of a recession and the attractiveness of long-term bonds.
For short-term bonds to convincingly rally too, we’ll instead need Central Banks to fully capitulate to the demand destruction narrative - it’s going to take a bit longer.
Hence, ladies and gentlemen: it’s time for some (bond) trades!
How do we structure those?
In my ETF portfolio, I have simply started to accumulate some long-end bonds (US: TLT; Europe: IBGL) as per this morning.
I am back into bonds for the first time since summer 2021 and I have allocated about 50% of my fixed income risk budget so far.
In my tactical portfolio, I have made 2 changes:
I’ve opened a US 2s10s flattener via futures (reference cash bonds entry: 14 bps).
I’ve taken profits on my SPX shorts (entry: 4385, profit: 3750) and scaled into a new equity trade: Short 2x Russell 2000 future (RTYA; entry: 1700), Long 1x Nasdaq future (NQA; entry: 11500).
The path of least resistance here should be for yield curves to meaningfully invert as recession warnings keep flashing in the back-end while Powell forces the front-end to reflect his unchanged hawkish stance.
As a tactical investor, although I like long-end bonds here I still prefer the risk/reward of flatteners or short bond volatility here.
When it comes to equity markets, the long-end bond rally might spur a tentative bid in valuation-intensive, YTD slaughtered tech while US small caps are likely to disproportionately suffer from an earnings slowdown while they won’t get any tailwinds from lower bond yields.
I want to capture the relative value there (long Nasdaq, short Russell) but I want to keep my net equity short exposure hence structuring the trade as 2x short Russell, 1x long Nasdaq.
And this was all for today, thanks for reading!
Please notice the next piece will be out on July 7th.
I’ll take a week off - the weather is too good and seaside too attractive here in the South of Italy for me to pass :)
Last but not least: if you are interested in any kind of partnership, sponsorship, or in bespoke consulting services feel free to reach out at TheMacroCompass@gmail.com.
May I ask you to be so kind and click on the like button and share this article around, so that we can spread the word about The Macro Compass?
It would make my day!
For any inquiries, feel free to get in touch at TheMacroCompass@gmail.com.
For more macro insights, you can also follow me on LinkedIn, Twitter and Instagram.
Feel free also to check out my new podcast The Macro Trading Floor - it’s available on all podcast apps and on the Blockworks Macro YouTube channel.
See you soon here for another article of The Macro Compass, a community of more than 60.000 worldwide investors and macro enthusiasts!
DISCLAIMER
The content provided on The Macro Compass newsletter is for general information purposes only. No information, materials, services, and other content provided in this post constitute solicitation, recommendation, endorsement or any financial, investment, or other advice. Seek independent professional consultation in the form of legal, financial, and fiscal advice before making any investment decision. Always perform your own due diligence.


Share this post